THE STATE OF LOCAL RETAIL
South Carolina
We analyzed transactions for every day of the 2017 calendar year at 54,000 small, independent retailers across America. The result is a comprehensive look at when local retailers earn the most money, when they’re busiest, and which states make the most from patrons who #shoplocal.
Understanding this report
To understand the average day for retailers in America, we need to take a multidimensional look at the revenue performance on a daily, weekly, monthly, and annual basis. To do this we break retailers’ daily revenue into the three key fundamental metrics we’ll use to identify trends:
Transactions, or how many individual payments retailers process, give us a sense of when retailers are busiest. While it is not an indication of visitors, it does tell us how many individual payments are processed during the period.
Purchase Price, or how much patrons spend on average per transaction, is an interesting metric to track for retailers. Often, the biggest revenue days for retailers are the same days when consumers spend the least per transaction.
Revenue is the metric that most business owners are familiar with. It’s the result of the number of transactions processed during the period and the amount consumers spent per transaction. It’s our mainsail metric and the one we used most to track the seasonal impact on local retailers.
South Carolina: LOCAL RETAILERS’ AVERAGE DAY
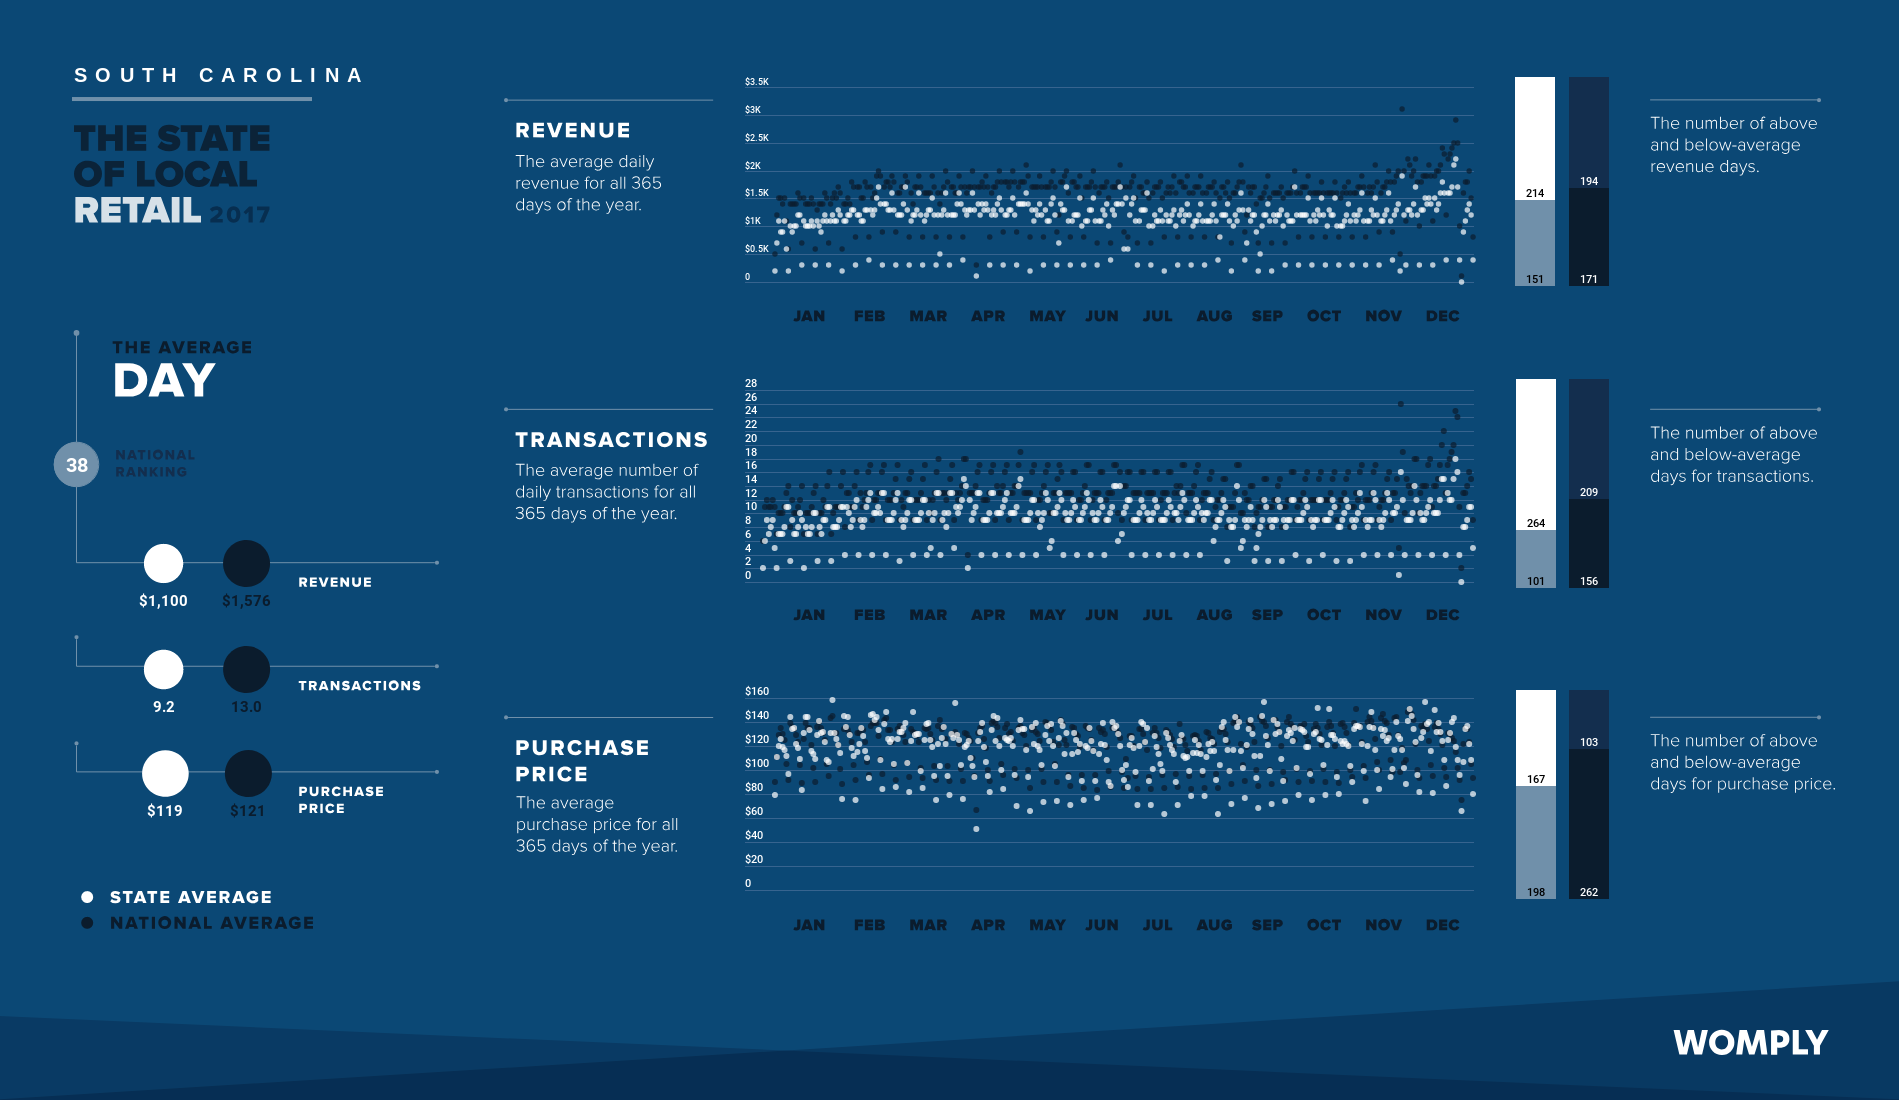
To get started, let’s take a look at the average day for local retailers in The Palmetto State: South Carolina. On an average day, local retailers in South Carolina process 9.2 transactions at $119 per purchase, which results in $1,100 in daily revenue. Compared to retailers in other states, South Carolina’s average daily revenue is 30.2% lower. They average 29.1% fewer transactions on a daily basis and their customers spend 1.6% less per purchase than consumers nationally.
SOUTH CAROLINA’S AVERAGE DAY
- REVENUE: $1,100
- TRANSACTIONS: 9.2
- PURCHASE PRICE: $119
- REVENUE RANK: 38th
All told, this makes South Carolina the 38th-ranked state for daily revenue generation, which puts them between Iowa (37th) and Arkansas (39th) in our national ranking.
South Carolina: local retailers’ average week
Next, let’s look beyond the daily trends to the average sales week for retailers in South Carolina. In 2017, local retailers in South Carolina typically made $7,722 each week, thanks to 65 weekly transactions at the average purchase price of $119.
SOUTH CAROLINA’S AVERAGE WEEK
- REVENUE: $7,722
- TRANSACTIONS: 65
- PURCHASE PRICE: $119
South Carolina’s local retailers’ average weekly revenue is 130.2% lower than the national average, and they process 28.6% fewer transactions than retailers nationally each week.
South Carolina: local retailers’ average daily revenue by day of the week
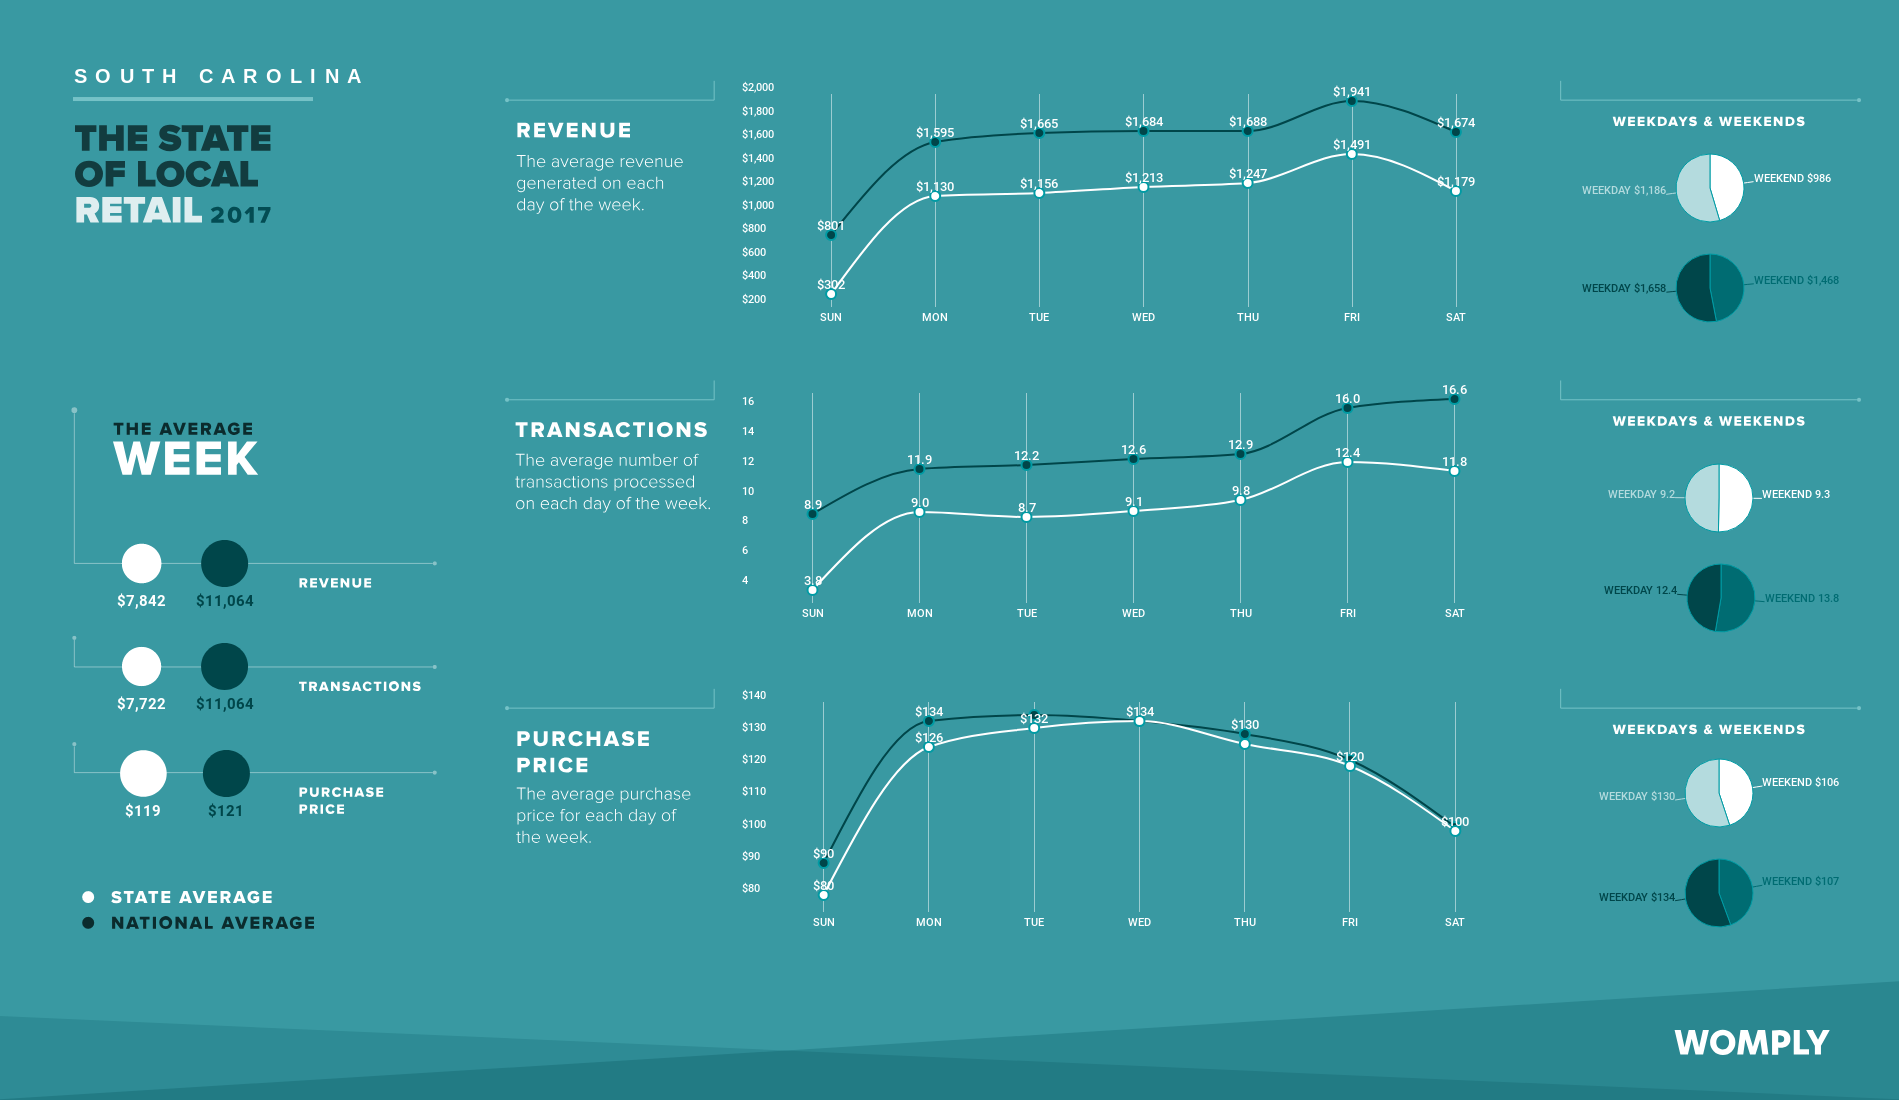
While it’s helpful to know what an average week looks like, most business owners can tell you just how different each day of the week can be for sales. To see how daily revenue changes during the week, refer to the top-center chart.
Independent retailers in South Carolina typically make $1,491 on Fridays which is 35.5% better than their average day, and 23.2% lower than retailers nationally. On the flip-side, Sunday is typically the slowest day for retailers in South Carolina, generating only $302.
South Carolina: local retailers’ daily transactions by day of the week
To see how the number of daily transactions changes from day to day, refer to the graph labeled, “transactions.”
In South Carolina, local retailers tend to be busiest on Fridays. With an average of 12.4 daily transactions, Friday is 34.9% better than their average day. On the other end of the spectrum, we have Sunday, their slowest day of the week, when they only average 3.8 transactions.
South Carolina: local retailers’ purchase price across the days of the week
Purchase price changes are quite interesting. In general, as the week goes on, the amount customers typically pay per purchase drops to the point that consumers are paying the least they pay all week on the busiest days for local retailers. To see how South Carolina compares to the national trend, refer to the graph labeled, “purchase price.”
In South Carolina, Wednesday is the day when consumers are spending the most per purchase, averaging $134 per purchase.
South Carolina: local retailers’ weekday vs. weekend
Next, let’s see how consumer spending at local retailers in South Carolina varies from weekdays to weekends. In this analysis, we have grouped Monday-Thursday as “weekdays,” and Friday-Sunday as “weekends.”
Let’s look at the overall revenue contribution of weekdays and weekends. Over the the course of an average week, local retailers in South Carolina make about $1,186 on weekdays and $986 on weekends.
South Carolina: local retailers’ top 3 weeks
It probably won’t surprise you to learn that most states have their best sales week during the holiday rush, but did you know that in 2017 the week leading up to Christmas Eve (December 17 to December 23) was the single best week for local retailers in 39 states and it was in the top-three weeks for 84% of local retailers nationally? Here’s a look at South Carolina’s top three weeks:
BEST WEEK
- December 17 – December 23
- 145% higher than their average week
SECOND-BEST WEEK
- December 10 – December 16
- 123% higher than their average week
THIRD-BEST WEEK
- May 7 – May 13
- 115% higher than their average week
South Carolina: local retailers’ average month
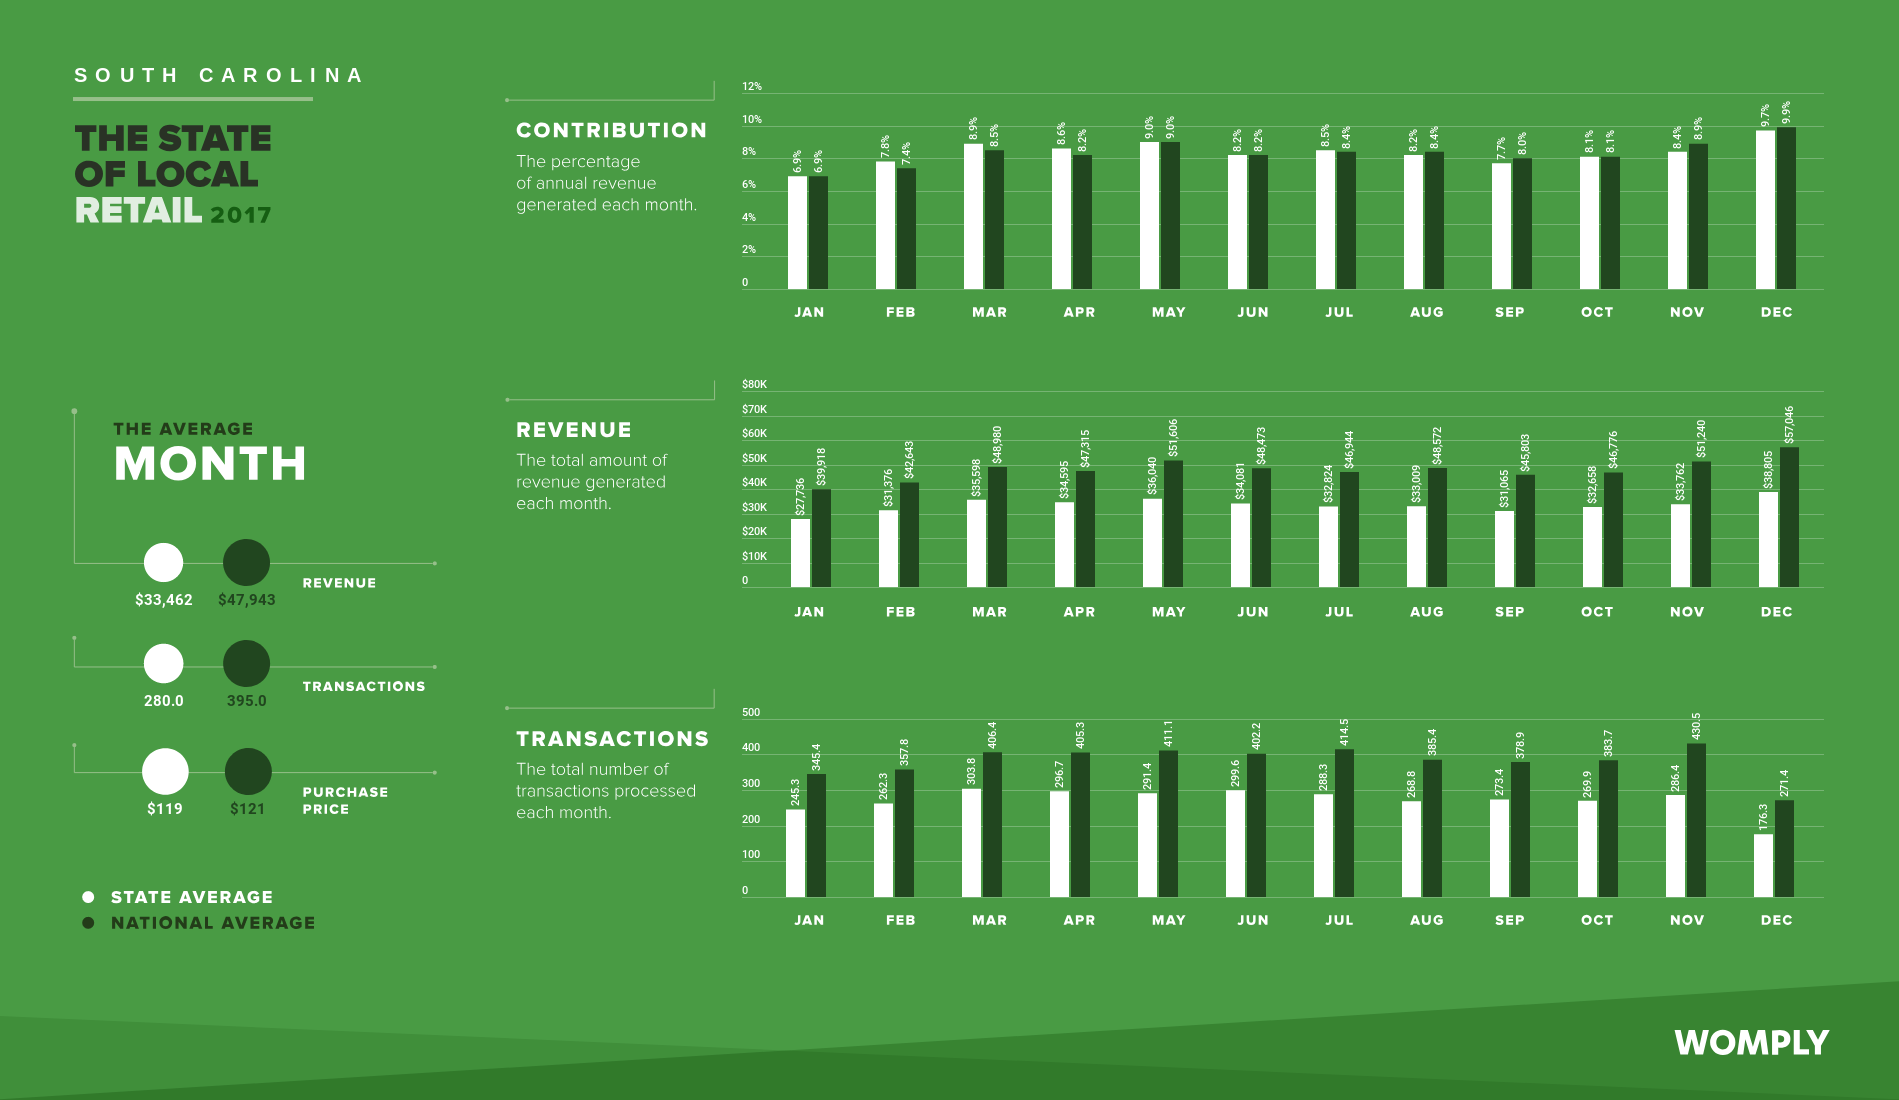
Now, let’s look at the average sales month for retailers in South Carolina and how annual revenue is distributed across the months of the year, as well as how much retailers in South Carolina typically made each month.
SOUTH CAROLINA’S AVERAGE MONTH
- REVENUE: $33,462
- TRANSACTIONS: 280
- PURCHASE PRICE: $119
For starters, local retailers in South Carolina average $33,462 in revenue each month, thanks to 280 monthly transactions at an average purchase price of $119.
Compared to retailers nationally, South Carolina’s retailers’ average monthly revenue is 30.2% lower, and they process about 29.1% fewer transactions on a daily basis.
South Carolina: local retailers’ percentage of annual revenue by month
In the graph above, we see the highest and lowest revenue-generating months for local retailers in South Carolina. This shows us that the average South Carolina retailer makes 9.7% of their annual revenue in December alone. In 2017, the retailers in South Carolina averaged $38,805 for the month. By contrast, January is typically the slowest month for retailers in South Carolina, as it only generates 6.9% of their annual revenue.
While a few percentage points may not seem that significant, there is a $11,069 difference in total monthly revenue between their best and slowest months.
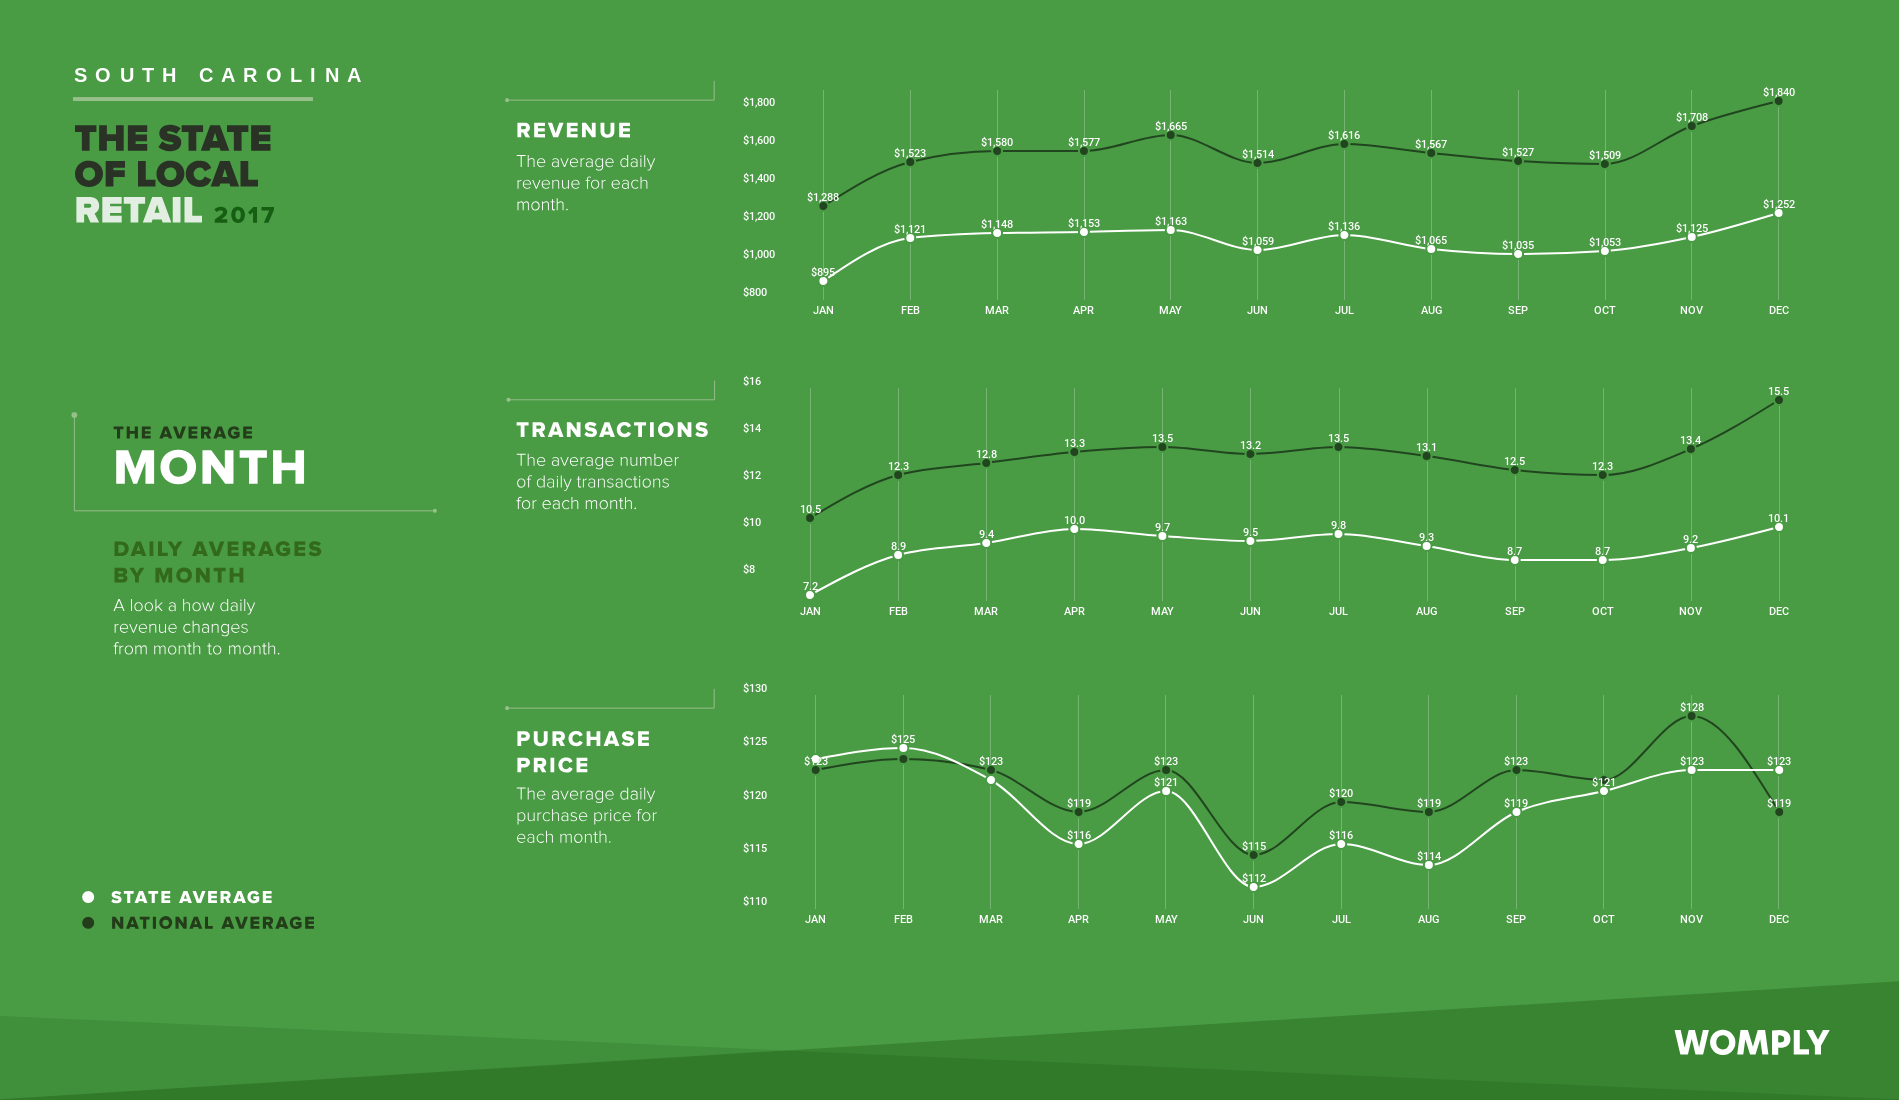
South Carolina: local retailers’ average daily revenue by month
Next, we’ll take a look at the daily revenue for local retailers on a month-to-month basis. The three graphs above illustrate just how much the average daily revenue, transactions, and purchase prices fluctuate from month to month.
For example, the best month for local retailer revenues in South Carolina is December, when local retailers typically make $1,252 per day.
South Carolina: local retailers’ average daily transactions by month
Next, we see how the average daily transaction volume varies from month to month, revealing the ebbs and flows of shoppers visiting local retailers in South Carolina. We can see that in December–the month when their transaction volume is highest–local retailers average 10.1 daily transactions.
South Carolina: local retailers’ average daily purchase price by month
Which month do consumers spend the most per-purchase with local retailers in South Carolina? February. Consumers tend to spend $125 per purchase, compared to their usual purchase price of $119.
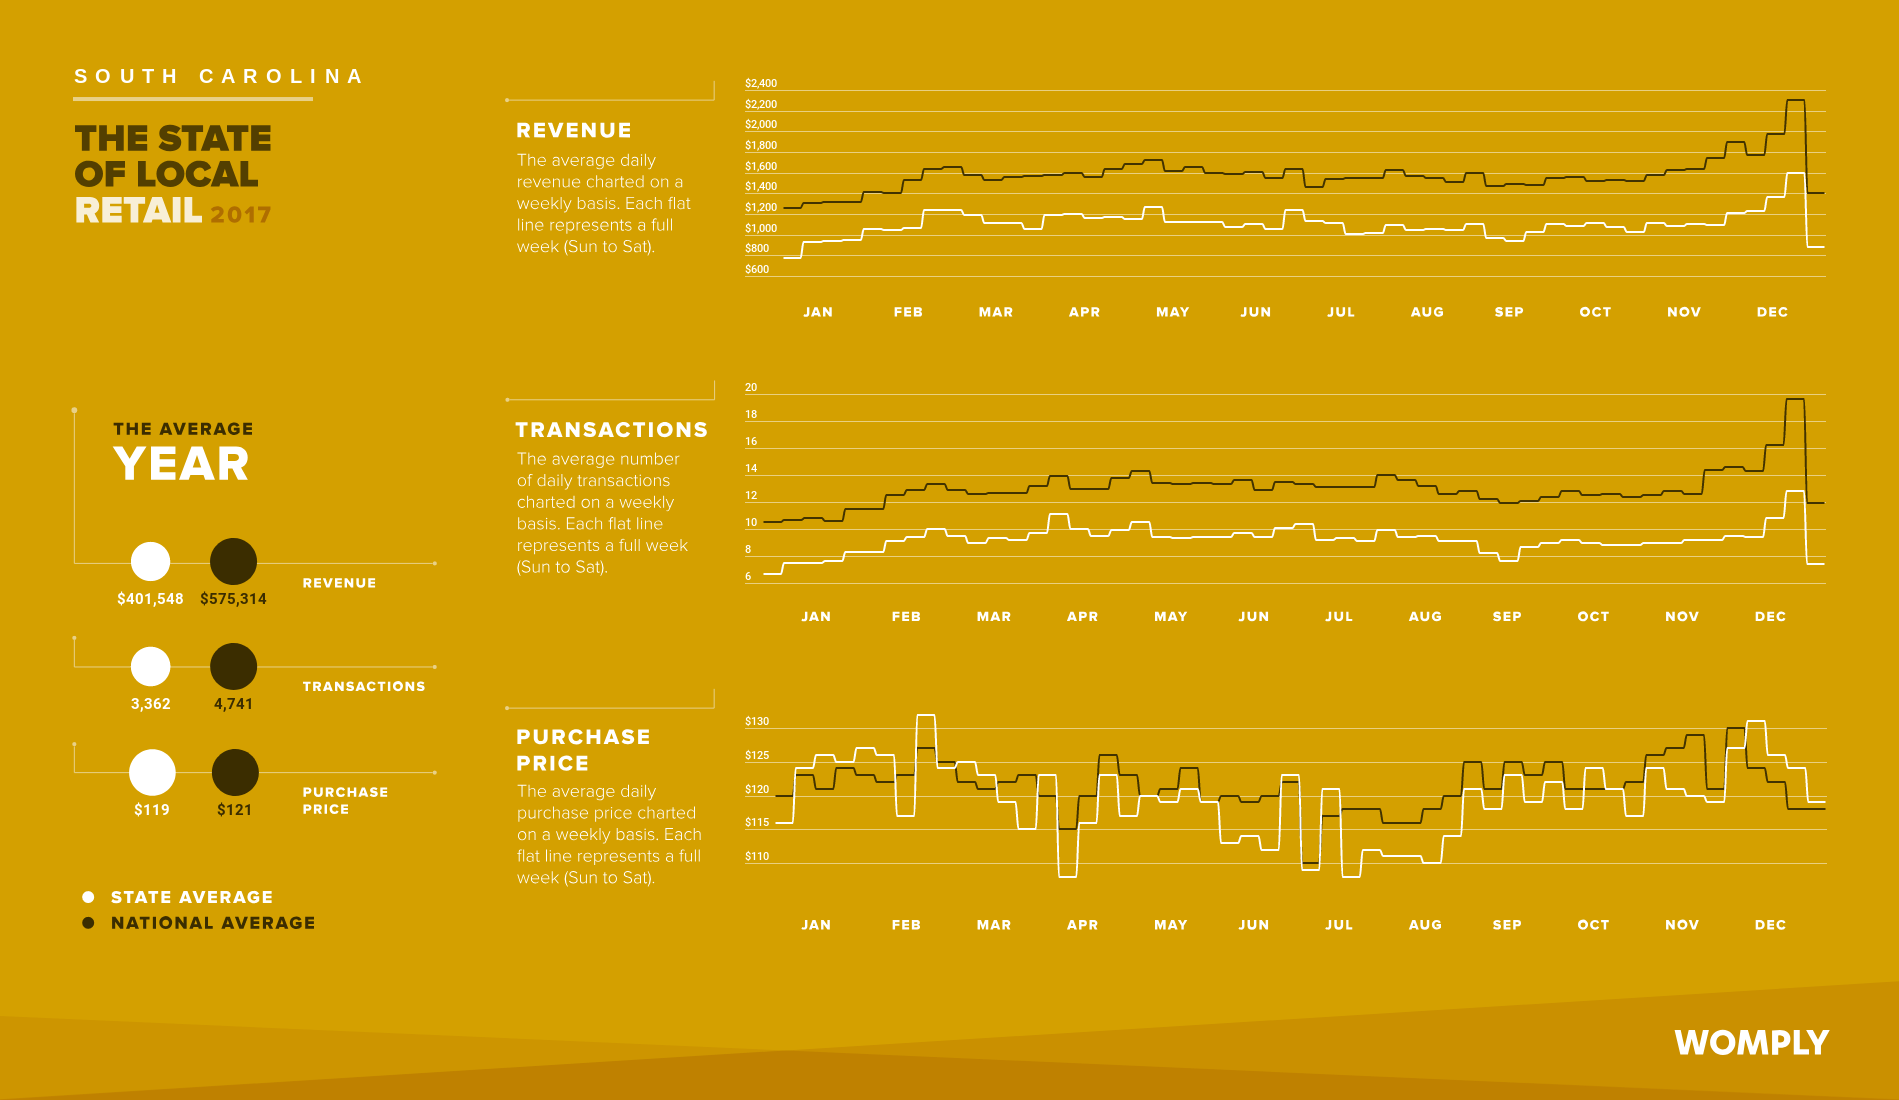
South Carolina: LOCAL RETAILERS’ AVERAGE YEAR
The graphs above give us a week-by-week look at revenue, transactions, and purchase price trends for local retailers in South Carolina across an entire year. Each flat line represents a full Sunday-to-Saturday week.
SOUTH CAROLINA’S AVERAGE YEAR
- REVENUE: $401,548
- TRANSACTIONS: 3,362
- PURCHASE PRICE: $119
All told, South Carolina retailers make about $401,548 in annual revenue over 3,362 total transactions at an average purchase price of $119. Compared to the retailers on the national level, retailers in South Carolina made 30.2% less in 2017 and processed 29.1% fewer transactions.
South Carolina: local retailers’ year-end trends
Unsurprisingly, the closer we get to the end of the year, the higher the weeks rank for sales. The end-of-year holiday rush is, without a doubt, the single biggest money-making period for retailers across the country, as well as for retailers in South Carolina.
Notice the general trends of South Carolina’s overall revenue, transactions and purchase price as they draw closer to the end of the year. On a national level, transactions spike the closer they get to Christmas, while the average purchase price drops as consumers take advantage of holidays deals. Take a look at the revenue trends for South Carolina and how they compare to the national trend.
South Carolina: LOCAL RETAILERS’ KEY HOLIDAY SALES PERIODS
The holidays are high season for retail sales. In fact, many states make 1 out of every 4 dollars during this period. Let’s look at how important November and December are in terms of total annual revenue generation and what an average day during these months looks like.
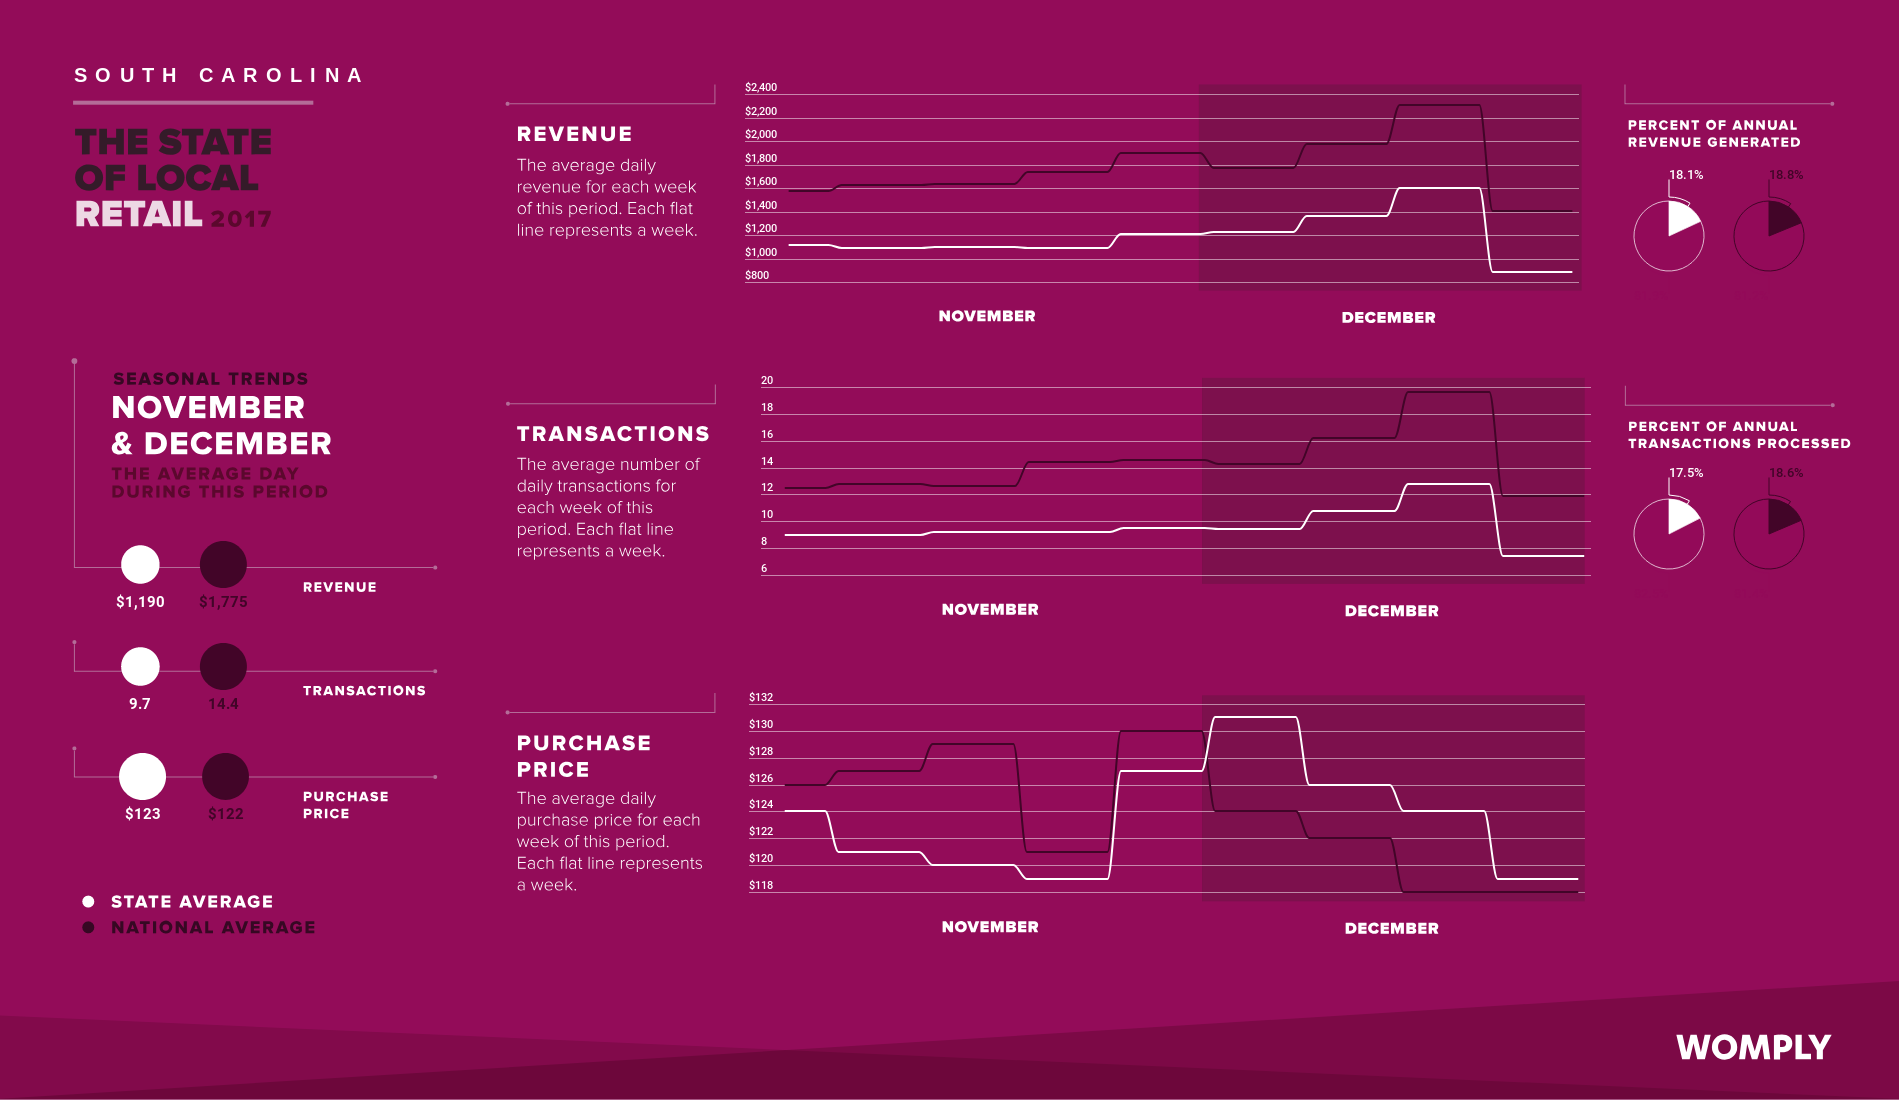
South Carolina: local retailers during November and December
With November and December accounting for so much of the revenue generated during the course of the year, it helps to know what the “average day” during this period looks like and how it compares to the “average day” during the rest of the year.
During November and December, local retailers average $1,190 in daily revenue which is 8.1% higher than their average day. Those same retailers process 9.7 transactions on a daily basis (4.8% more than their average day). And the consumers’ average purchase price increases 3.2% to $123.
All said, the months of November and December account for 18.1% of South Carolina’s annual revenue generation and 17.5% of the year’s total transactions.
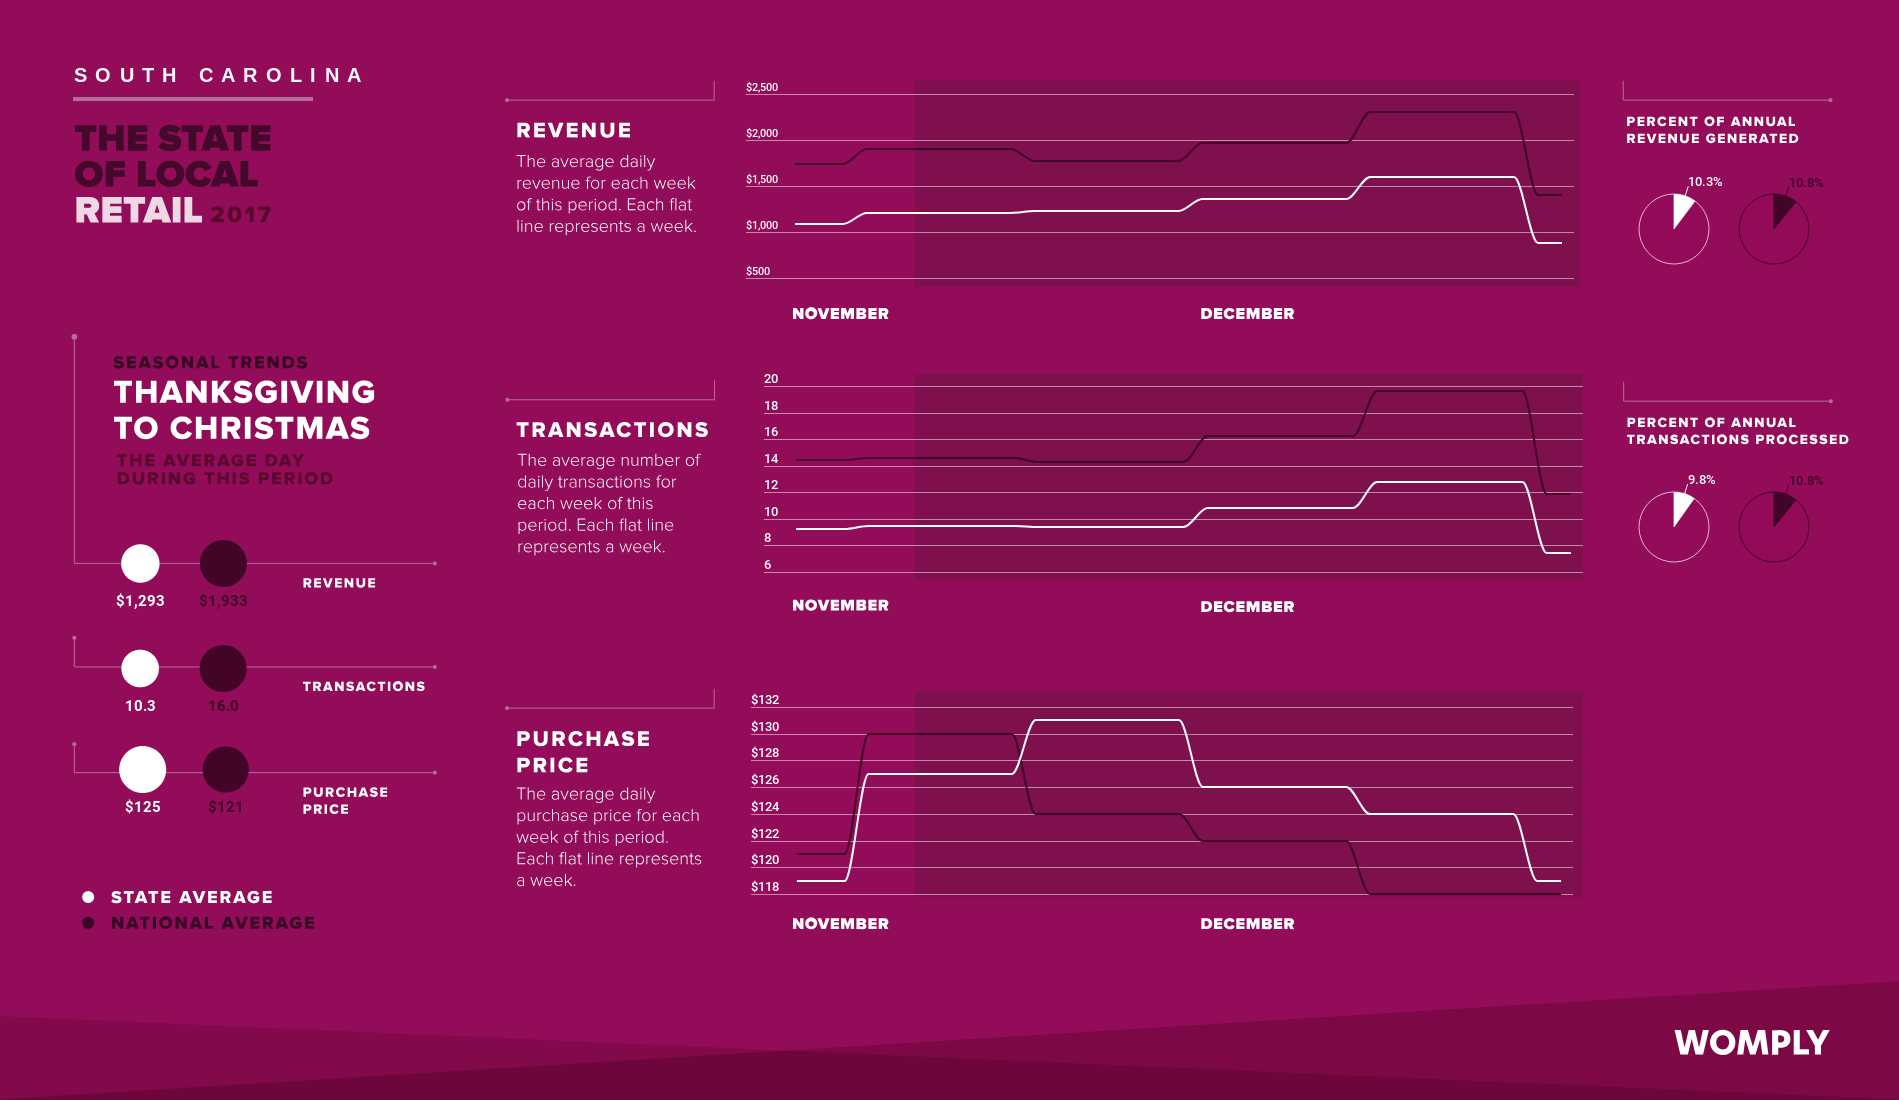
South Carolina: local retailers from Thanksgiving to Christmas
For many people, including most retailers, the holiday sales season doesn’t begin until Black Friday. In fact, the sales periods from Thanksgiving to Christmas is a four-week sprint for retailers across the country.
In South Carolina, local retailers typically average $1,293 in daily revenue between Thanksgiving and Christmas. That’s a 17.5% bump from their average day. Those same retailers process 10.3 transactions on a daily basis (a 12.2% lift compared to their average day), and the consumers’ average purchase price increases 4.7% to $125.
All told, the Thanksgiving-to-Christmas sales period accounts for 10.3% of the revenue and 9.8% of the year’s transactions for retailers in South Carolina.
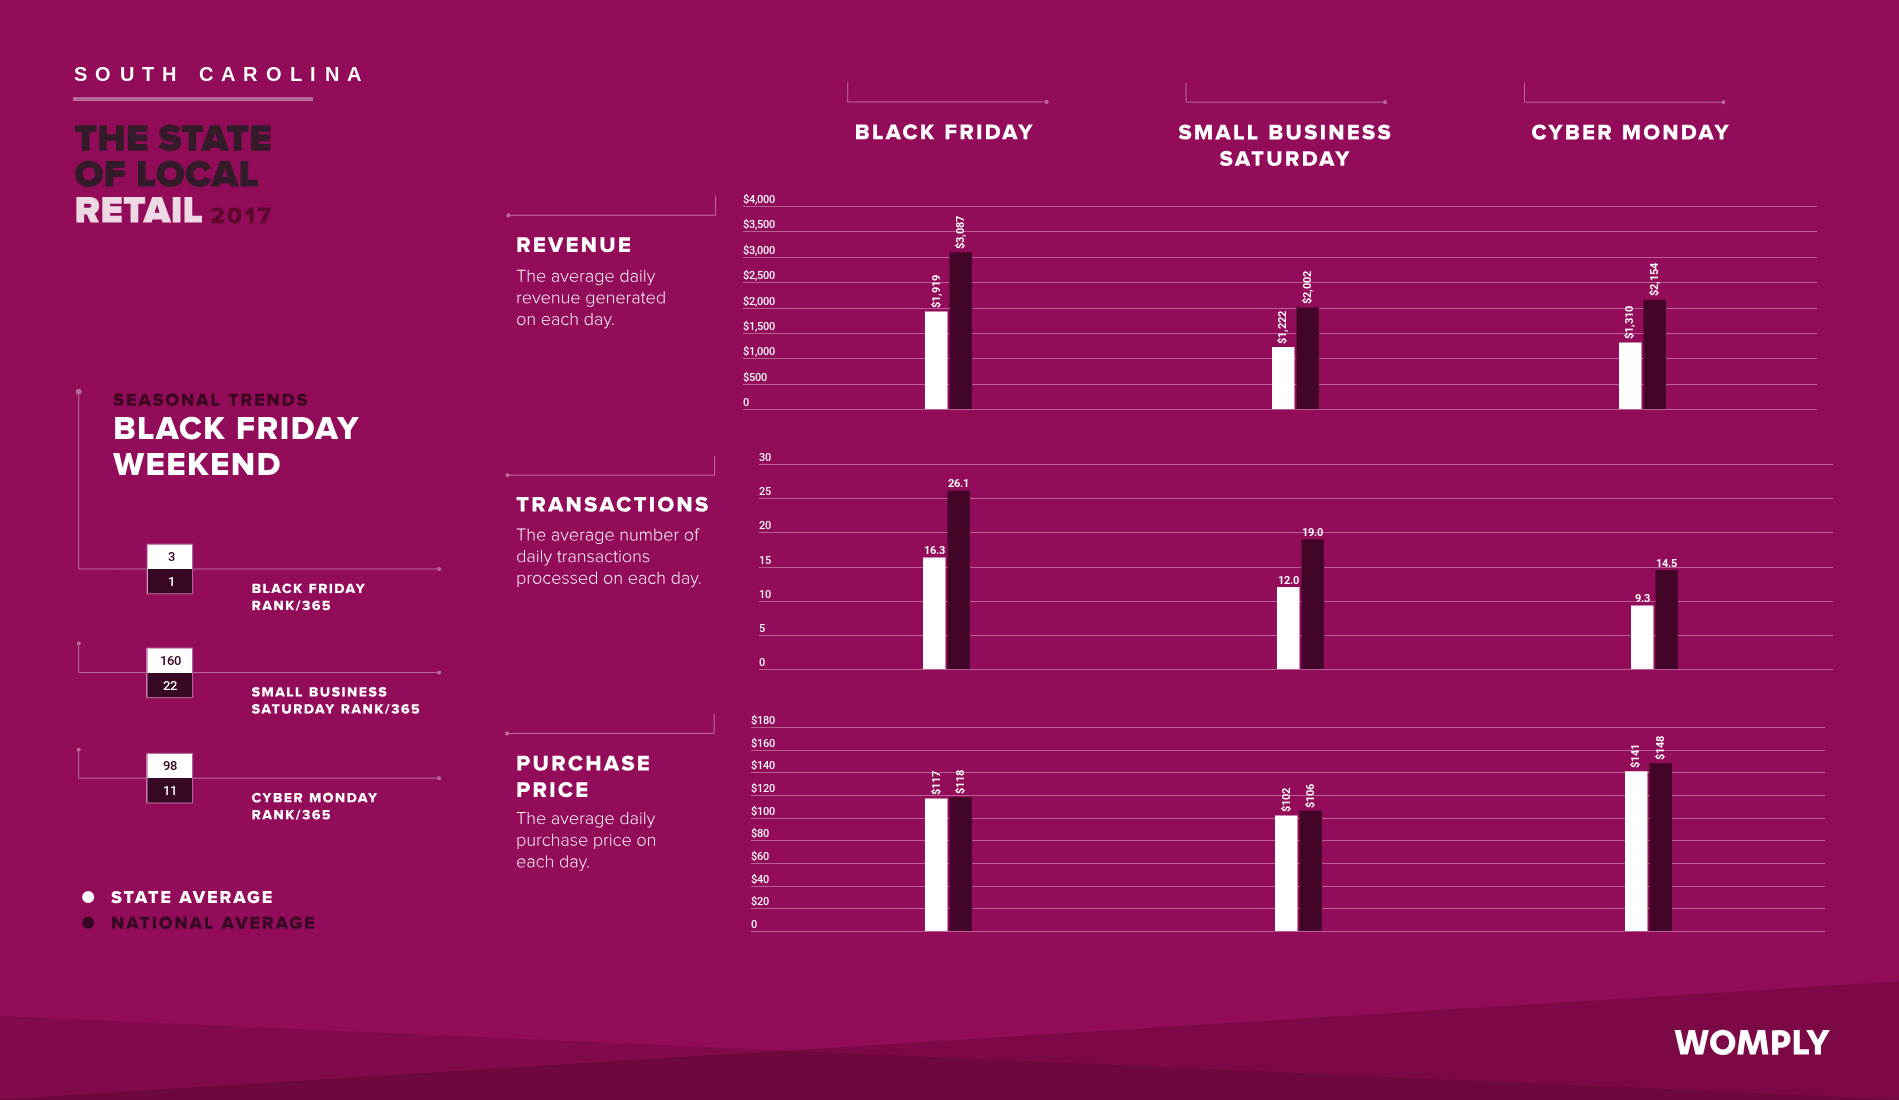
South Carolina: LOCAL RETAILERS’ REVENUE TRENDS ON BLACK FRIDAY, SMALL BUSINESS SATURDAY, AND CYBER MONDAY
You can’t talk about holiday sales without mentioning Black Friday, Small Business Saturday, and Cyber Monday. In fact, they are some of the best revenue-generating days for local business owners across the country. Let’s closer look at each of these key sales days.
South Carolina: local retailers’ average Black Friday
On average, in 2017, Black Friday was the best sales day of the year for local retailers. When we ranked all 365 days of the year for the amount of revenue generated, Black Friday was one of the top 3 days for 40 of the 50 states. In fact, Black Friday was in the top 20 days for every state but Arkansas (where it was the 42nd-best) and Wisconsin (81st).
For local retailers in South Carolina, Black Friday was the 3rd-best revenue-generating day of the year. Across the state, local retailers averaged $1,919 in daily revenue, which is 74.4% better than their average day.
BLACK FRIDAY IN SOUTH CAROLINA
- DAY RANK: 3rd
- REVENUE: $1,919
- TRANSACTIONS: 16.3
- PURCHASE PRICE: $117
Compared to the national average retailer, those in South Carolina made 37.9% less in daily revenue on Black Friday. They averaged 16.3 transactions, which is 37.3% less than the national average. Their average purchase price of $117 is 0.9% lower than other states.
South Carolina: local retailers’ average Small Business Saturday
It’s hard to follow up Black Friday’s monumental revenue lift, but Small Business Saturday still packs a punch for local retailers’ revenue. It’s in the top 100 days of the year for 37 states and the 15th-best day of the year nationally.
SMALL BUSINESS SATURDAY IN SOUTH CAROLINA
- DAY RANK: 160th
- REVENUE: $1,222
- TRANSACTIONS: 12
- PURCHASE PRICE: $102
For independent retailers in South Carolina, Small Business Saturday was the 160th-highest revenue generating day of the year. Across the state, local retailers averaged $1,222 in daily revenue, 12 transactions, and a purchase price of $102. Compared to retailers across the country, Small Business Saturday revenues were 39% below the national average in South Carolina.
South Carolina: local retailers’ average Cyber Monday
Cyber Monday isn’t just for e-commerce companies like Amazon; it’s the 11th-best sales day of the year for local retailers across the United States.
For local retailers in South Carolina, Cyber Monday was their 98th-best day of the year. Across the state, local retailers averaged $1,310 in daily revenue, 9.3 transactions, and an average purchase price of $141.
CYBER MONDAY IN SOUTH CAROLINA
- DAY RANK: 98th
- REVENUE: $1,310
- TRANSACTIONS: 9.3
- PURCHASE PRICE: $141
Compared to the national average retailer, South Carolina’s local retailers made 39.2% less in daily revenue on Cyber Monday. Their transactions were 36.2% below the national average, while their average purchase price was 4.8% lower than other states.
South Carolina: local retailers’ prominent days vs. their average day
Retailers put a lot of focus and work into holidays and big-sale days. Here’s how South Carolina retailers’ prominent days rank compared to their average day.
| DAY | RANK/365 | DAILY REVENUE | CHANGE IN REVENUE | DAILY TRANSACTIONS | CHANGE IN TRANSACTIONS | AVG PURCHASE PRICE |
CHANGE IN PURCHASE PRICE
|
| MLK day | 227 | $ 1,132.84 | 3% | 8.64 | -6% | $ 131.09 | 10% |
| Valentine’s Day | 183 | $ 1,189.07 | 8% | 9.72 | 5% | $ 122.40 | 2% |
| President’s Day | 83 | $ 1,339.60 | 22% | 9.17 | 0% | $ 146.03 | 22% |
| St. Patrick’s Day | 25 | $ 1,555.93 | 41% | 11.98 | 30% | $ 129.88 | 9% |
| Easter Sunday | 364 | $ 98.93 | -91% | 1.94 | -79% | $ 50.91 | -57% |
| Cinco de Mayo | 33 | $ 1,486.98 | 35% | 12.40 | 35% | $ 119.96 | 0% |
| Mother’s Day | 357 | $ 242.80 | -78% | 3.67 | -60% | $ 66.19 | -45% |
| Memorial Day | 213 | $ 1,153.45 | 5% | 9.09 | -1% | $ 126.89 | 6% |
| Father’s Day | 337 | $ 299.65 | -73% | 3.87 | -58% | $ 77.38 | -35% |
| July 4th | 307 | $ 635.21 | -42% | 7.40 | -20% | $ 85.86 | -28% |
| Veteran’s Day | 205 | $ 1,164.17 | 6% | 11.60 | 26% | $ 100.38 | -16% |
| Thanksgiving | 363 | $ 166.42 | -85% | 1.32 | -86% | $ 125.76 | 5% |
| Black Friday | 3 | $ 1,918.79 | 74% | 16.34 | 77% | $ 117.42 | -2% |
| Small Business Saturday | 160 | $ 1,221.84 | 11% | 11.98 | 30% | $ 102.00 | -15% |
| Cyber Monday | 98 | $ 1,309.75 | 19% | 9.27 | 1% | $ 141.35 | 18% |
| Christmas Eve | 312 | $ 419.40 | -62% | 4.35 | -53% | $ 96.45 | -19% |
| Christmas Day | 365 | $ 22.76 | -98% | 0.35 | -96% | $ 65.51 | -45% |
| New Year’s Eve | 314 | $ 393.83 | -64% | 4.90 | -47% | $ 80.37 | -33% |
METHODOLOGY
Womply analyzed daily revenue for 54,000 local, independent retailers in all 50 states and the District of Columbia for all 365 days of the 2017 calendar year. Retailers were only qualified for the analysis if Womply had a full year of transaction history and the business recorded multiple transactions per day. Category and overall state rankings are based on a composite score of each state’s transactions, average ticket sizes, and overall daily revenue.
ABOUT WOMPLY
Womply is a software-as-a-service (SaaS) provider to small businesses and one of the fastest growing software companies in America. Our mission is to help small businesses thrive in a digital world. Every day we serve more than 100,000 small businesses across 400+ business verticals, in every corner of America. To learn more, visit https://www.womply.com or email info@womply.com.