There’s no question that Halloween is one of the most popular holidays of the year. And while it’s long been a favorite holiday among kids across the country, its popularity among adults has skyrocketed over the past decade. According to the National Retail Federation, Halloween spending is expected to reach a whopping 8.8 billion dollars in 2019.
Attract new customers and keep them loyal with reputation management software. Learn more, plus get free reputation monitoring and customer insights when you sign up for Womply Free!
In a recent article, we discovered that Halloween really moved the needle for local thrift shops as shoppers looked for low-cost costume solutions. As Halloween approaches, we wanted to see what other types of businesses cash in during the spookiest season of the year. And we decided to start by looking at local bars and lounges.
Do adults love to celebrate the holiday by dressing up, grabbing some drinks, and busting out their best rendition of the Thriller zombie dance?
We analyzed credit card transaction data at over 3,000 local bars and lounges across the country to find out if Halloween really moves the needle, which cities are home to the busiest bars on Halloween, and a whole lot more.
How much do bars and lounges make on an average day?
To get a better idea as to how Halloween looks at bars and lounges, let’s start by looking at the average day throughout the year.
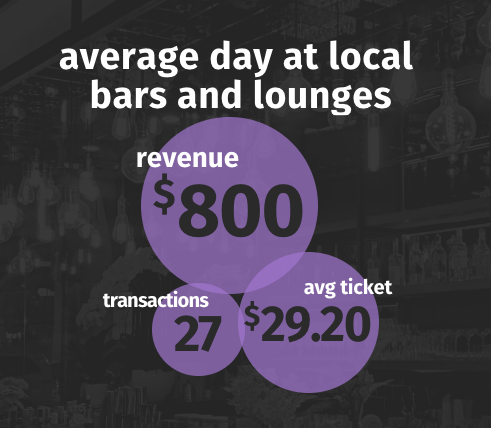
The average bar or lounge in our analysis brought in about $800 in daily revenue on average throughout the year. Looking closer, we see they process on average about 27 daily transactions with an average ticket of $29.20.
Of course, this is only an average across many different types of bars and lounges, and a “typical day” at a local bar or lounge can look quite different depending on the type of business and its location. For example, several bars in our analysis averaged well over a hundred transactions per day, while others averaged fewer than five.
Average ticket price also varied greatly, with some locations seeing average tickets well over the $150 range, while others only averaged around $10 per ticket.
Outliers aside, however, the vast majority of bars and lounges in our analysis fall pretty close to the numbers above.
How big are weekends for local bars and lounges?
The numbers in the previous section represent the average day throughout the entire year. But, as you might expect, bars and lounges aren’t exactly known for pulling in big business on weeknights. And since Halloween fell on a Wednesday last year, we next decided to drill deeper and take a look at each day of the week.
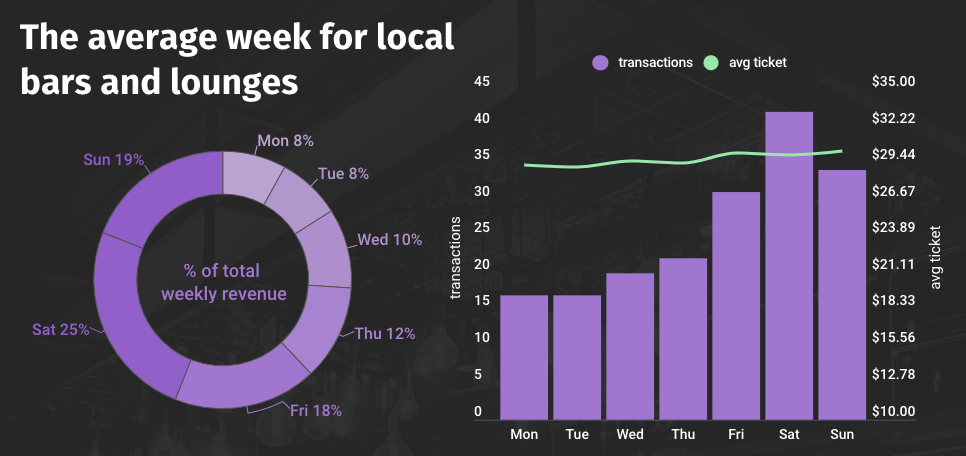
As we expected, weekends are absolutely massive for bars and lounges. Saturdays are easily the biggest days of the week, responsible for a quarter of all dollars spent at local bars and lounges throughout the year. Sundays and Fridays aren’t far behind, however, as 62% of all dollars spent at local bars and lounges came in on the weekends alone.
When you take a closer look at the numbers you can see that this is entirely a result of huge increases in foot traffic over the weekends. On average bars process over 40 transactions on Saturdays, compared to the overall average of 27 and the weekly low of 17 transactions on Mondays and Tuesdays.
Average ticket price, meanwhile, stays remarkably flat throughout the week—evidence that individual patrons aren’t spending more or less on any day of the week, and it really is primarily about foot traffic for local bars and lounges.
How big is Halloween for local bars and lounges?
Now that we’ve learned about the typical day for local bars and lounges, let’s take a look at Halloween itself.
Because Halloween falls on a different day of the week every year, we suspect its impact on bars and lounges can vary greatly from one year to the next. Last year Halloween was on a Wednesday, usually the third slowest day of the week, and a day where average transactions are 53% lower than on typical Saturdays.
So let’s start first by looking at how big Halloween was for bars and lounges last year when compared to a typical Wednesday.
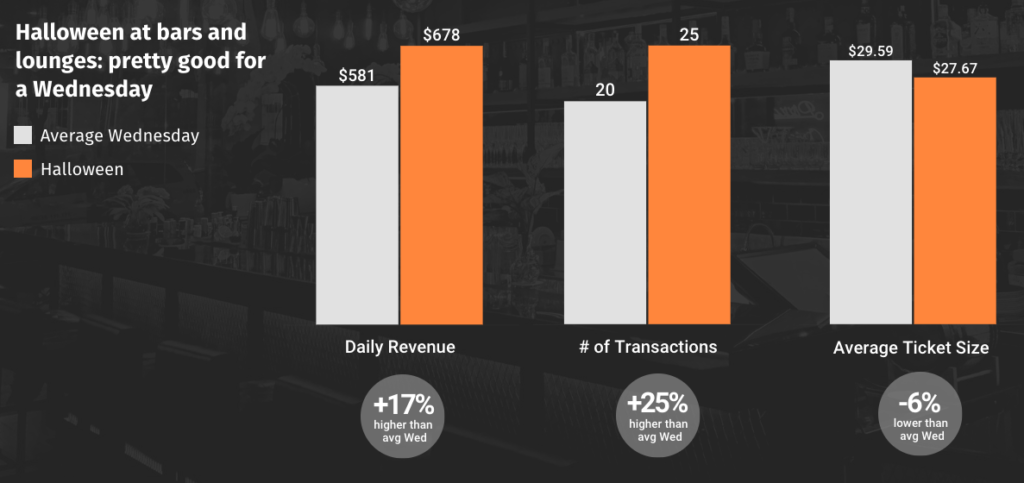 It should come as no surprise that bars and lounges were much busier on Halloween than on a typical Wednesday. On average, bars pulled in 17% more in revenue and processed 25% more transactions on Halloween than on a typical Wednesday.
Interestingly, average ticket price was lower than on a typical Wednesday, suggesting costumed patrons aren’t ponying up for fancier drinks or running larger tabs on Halloween.
And while Halloween was by no means a dud, we expected to see a larger bounce than the figures above. In fact, Halloween was only the 3rd biggest Wednesday of the year by average daily transactions at bars and lounges (July 4th was the biggest, followed by the day before Thanksgiving—aka, “Drinksgiving”).
Halloween celebrations aren’t just limited to October 31st, however, especially when the holiday falls mid-week. So we zoomed out and looked at the broader seasonal trend at bars and lounges by examining average transactions by week throughout the year.
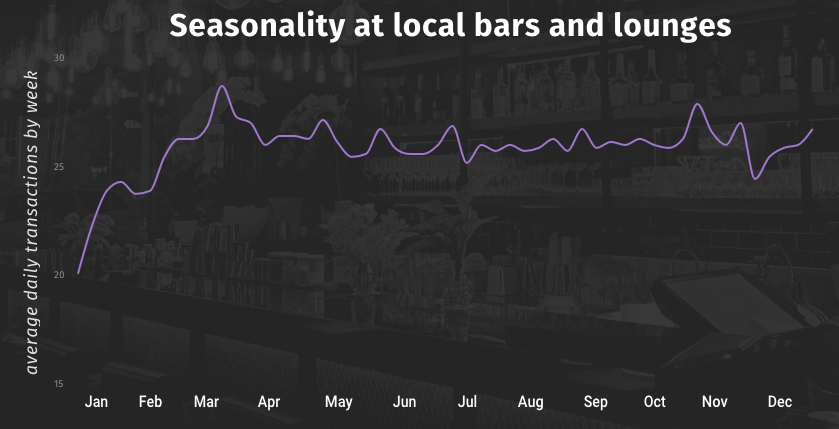
The year starts out on a slow foot, perhaps due to many Americans swearing off booze as part of their New Year’s resolutions. Things pick up rather quickly, however, as the busiest week of the year falls in March thanks to St. Patrick’s Day—which was responsible for the biggest day of the year last year.
Things hold more or less steady throughout the rest of the year, with slight bumps around other major holidays. Halloween does appear to move the needle when viewed from this perspective. This suggests that during years where the holiday falls mid-week, bars may be less likely to have a single “huge” day, but rather above-average sales over the course of several days.
Which cities are home to the busiest bars and lounges on the weekend before Halloween?
While the figures above show us how things look nationwide, we were curious which cities—if any—were home to bars and lounges who made a killing during Halloween.
Nationally, the biggest day around Halloween was the Saturday before the holiday (the 27th), which was the 30th biggest day of the year. Naturally, we wanted to first see if there were any cities where Halloween was responsible for one of the top days of the year. Here’s what we found:
Halloween was responsible for one of the top 10 days of the year in 10 metro areas in our analysis (and for one city, Halloween was responsible for two of the top days of the year!).
| City | Day | Overall day rank |
| Kansas City, MO | Sat, Oct 27 | 1st |
| New York, NY | Sat, Oct 27 | 1st |
| Salt Lake City, UT | Sat, Oct 27 | 2nd |
| Pittsburgh, PA | Sat, Oct 27 | 3rd |
| Salt Lake City, UT | Fri, Oct 26 | 3rd |
| Philadelphia, PA | Sun, Oct 28 | 5th |
| Billings, MT | Fri, Oct 26 | 5th |
| Pensacola, FL | Sun, Oct 28 | 5th |
| Lousiville, KY | Sun, Oct 28 | 6th |
| Austin, TX | Fri, Oct 27 | 7th |
| San Jose, CA | Sat, Oct 26 | 8th |
Kansas City and New York locals clearly love celebrating Halloween with a night out on the town, as the Saturday before the holiday was the single-biggest day of the year for bars and lounges in both cities. Salt Lake City bars and lounges also appear to stay extremely busy over Halloween, as the Friday and Saturday before were the 2nd and the 3rd biggest days of the year in the Utah capital.
The least Halloween-happy city in our analysis was Baltimore, MD, where even their busiest day during Halloween (Saturday the 27th) was good for only the 107th busiest day of the year.
Which cities were busiest on Halloween itself?
With Halloween falling on a Wednesday, it wasn’t a top day in any of the cities on our analysis. But that didn’t mean some cities didn’t have a hoppin’ Halloween at their local watering holes. Here’s a look at where bars and lounges were busiest on Halloween.
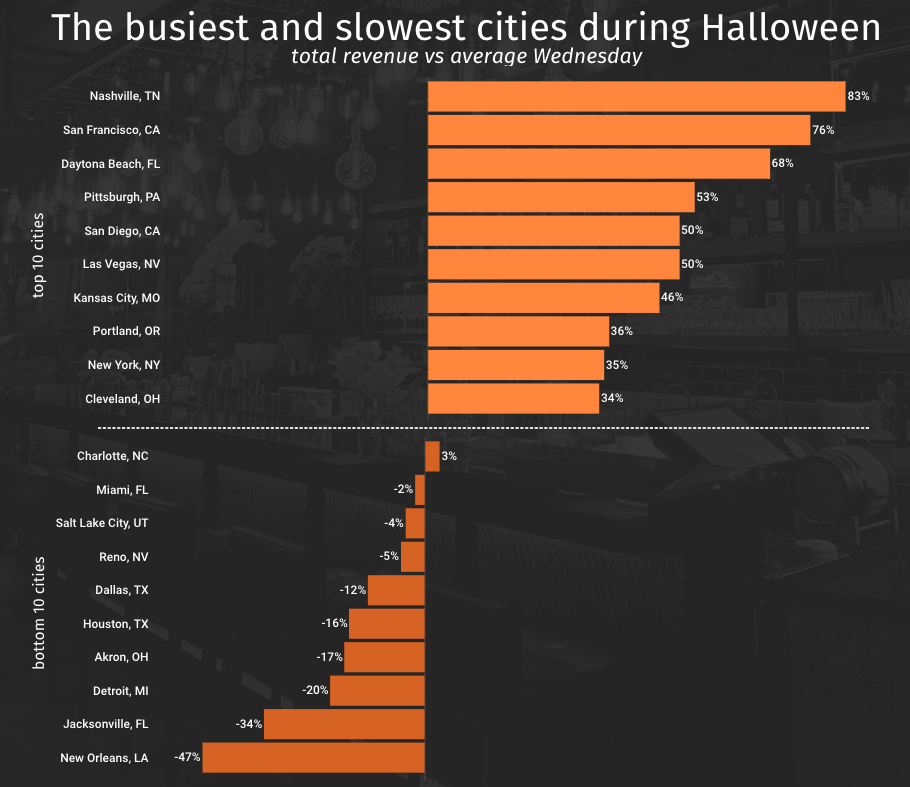 Bars and lounges in Nashville had the biggest Halloween when compared to a typical Wednesday, bringing in 83% more in total revenue. Bars and San Francisco and Daytona Beach also did quite well, and Kansas City continues to solidify its presence as a big Halloween town by grabbing the #7 spot on Halloween.
On the other end of the spectrum, New Orleans took the crown as having the least impressive Halloween bump, as bars and lounges there brought in 47% less in revenue than vs a typical Wednesday. Our hypothesis is that this may be due to the Crescent City’s reputation as being an “all days of the week” kind of party town. So, unlike in other cities, Halloween has much stiffer competition on other Wednesdays.
Interestingly, Salt Lake City appears in the bottom 10 list after Halloween weekend accounted for two of the top five days of the year there. Suggesting, perhaps, that patrons in the traditionally family-friendly city prefer to go out for drinks on the weekend and spend Halloween taking the kids out for a night of trick-or-treating.
How to get the most out of the busiest days of the year if you own or manage a bar or lounge
Do you own your own local bar or lounge? If so, does Halloween drive big business in your doors? Or do you struggle to get hordes of costumed patrons in during the spooky season?
As we detailed in the article above, Halloween is all about increases in average transactions, so it’s all about drawing extra customers into your doors. Look for ways to cement your bar or lounge as the place to be on Halloween. Try running a special event like a costume contest, a spooky-themed trivia night, a Halloween movie marathon, or even just some seasonal-themed drinks.
If your business is already a hit during Halloween, think about how you can capitalize on the influx of foot traffic by getting more reviews for your bar, or enticing customers to follow you on social media or provide their email address for future discounts and deals. That way, when things slow down later on, you’ll be a step ahead.
Check out a few of our helpful guides for bar and lounge owners:
- How to get more reviews
- 25 free listing sites every small business should be on
- 25 free local business advertising ideas
Finally, check out how Womply’s reputation management software helps make all this easier while saving you time and money. Womply has helped businesses like yours increase revenue by 20%, see 22% more repeat customers, and save 10 hours of time per week. Learn more, plus get free reputation monitoring and customer insights when you sign up for Womply Free!