We’re just five business days away from the federal tax filing deadline, so this week we are looking at local, independent legal and financial businesses. We analyzed transactions for independent legal and financial businesses for every single day of the 2017 calendar year to see how revenue ebbs and flows for these businesses.
To get started, let’s talk about one of the most dreaded days of the year: the federal tax filing deadline. (No joke, 18% of Americans would rather memorize all of the U.S. presidents in order than file taxes).
If you’re like us, you might expect the last day to file taxes to be the number one day for legal and financial businesses, so you might be surprised to learn that it is actually only the 44th best day of the year. That said, in 2017, tax day revenues were 23.7% higher than the average day. Let’s take a look at the rest of the year.
The average day for legal and financial businesses

As you know, we like to look at revenue trends on three dimensions: the number of transactions, the amount spent per transaction, and how those two metrics add up to daily sales revenue. On any given day, the average legal and financial business will see about 15 transactions at about $213 per customer. This brings the daily sales revenue average to about $3,132.
The average week for legal and financial businesses
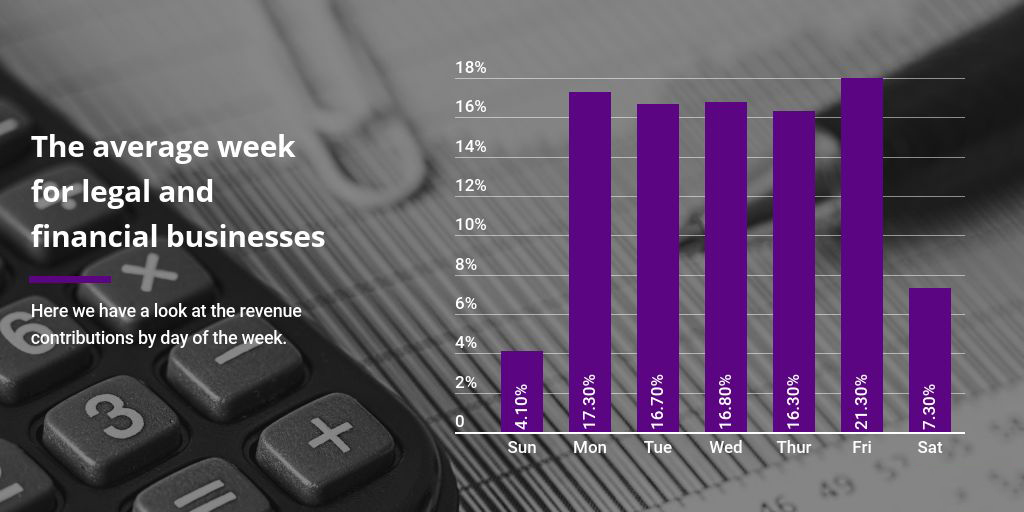
The above graph shows the distribution of revenue over the days of the week. It shows us which days are the strongest for revenue, as well as which contribute the least to the weekly total.
- Sunday – 4.10%
- Monday – 17.30%
- Tuesday – 16.70%
- Wednesday – 16.80%
- Thursday – 16.30%
- Friday – 21.30%
- Saturday – 7.30%
The average week for local financial businesses is very consistent. Unlike most small businesses in other industries, legal and financial businesses don’t generate much of their weekly revenue on the weekend, which makes sense given the nature of these companies.
The average year for legal and financial businesses
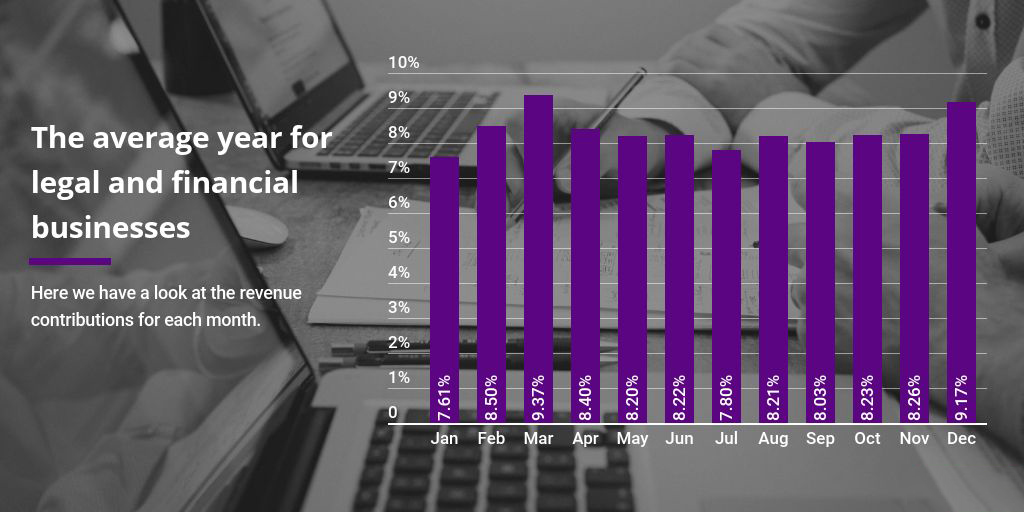
Just as we look at the daily contribution of revenue, we like to see how each month contributes to annual revenue. For the most part, the month-to-month fluctuations are small, suggesting very little seasonality when you simply look at month-to-month sales trends.
- January – 7.61%
- February – 8.50%
- March – 9.37%
- April – 8.40%
- May – 8.20%
- June – 8.22%
- July – 7.80%
- August – 8.21%
- September – 8.03%
- October – 8.23%
- November – 8.26%
- December – 9.17%
March is the best month for legal and financial business’s revenue. In March, revenues are about 12.6% better than average, and transactions go up 7.65%. This is not at all surprising, as March falls during the peak of tax season.
We did, however, make a few interesting observations. The first is December. Despite holiday sales and the general rush of the season around that time of year, December is the second-best month for legal and financial business revenue, not February or April as you may have assumed.
The second interesting observation is around transactions in September. While September is only the 10th best month for revenue, it is the #1 month for transactions. Legal and financial businesses see 23.5% more transactions in September than the average month, which is even higher than March’s total. In fact, more than 10% of the year’s total transactions take place in September.
The seasonality of legal and financial businesses
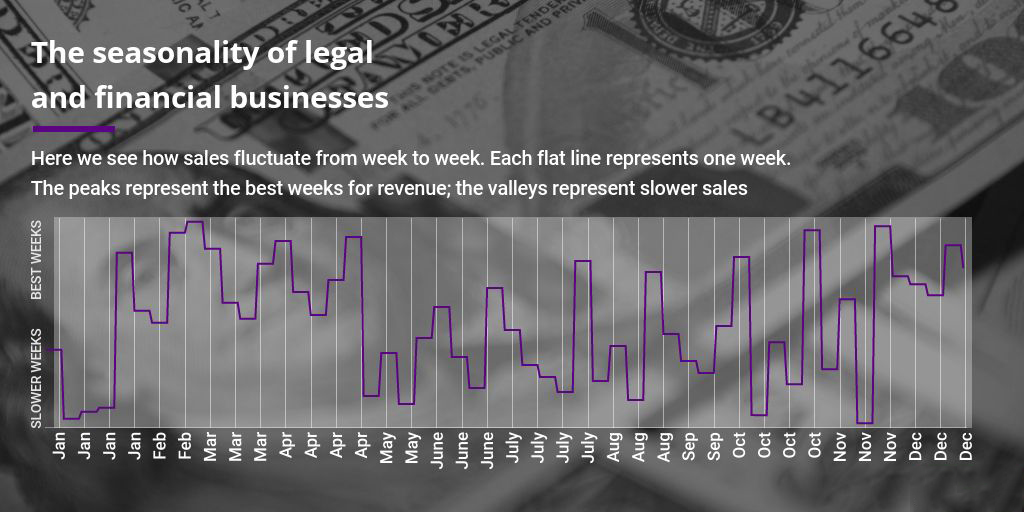
Lastly, we have a look at the week-to-week seasonality for legal and financial businesses over the course of the year. In the graph above we see every week of the year. The higher the peak, the better that week is for revenue (and vice-versa).
When it comes to legal and financial businesses, we see several of seasonal shifts that we’d expect. For example, we see more of busy weeks in the first quarter of the year head of tax season. However, when we look at the rest of the year, we see that, rather than a gradual shift from the best weeks to the worst weeks, we see spikes at the end of the month.
A quick note on this graph: This graph shows week-to-week seasonality over the course of the year. The month labels on the x-axis provide context but don’t exactly represent each month’s four weeks. This is due to some months starting mid-week, which makes it appear that some months don’t have fair representation, but that is not the case. For example, February started on a Wednesday and ended on a Tuesday. Because of this, the first week is counted in January and its last week is counted in April.
The top 3 weeks for legal and financial businesses
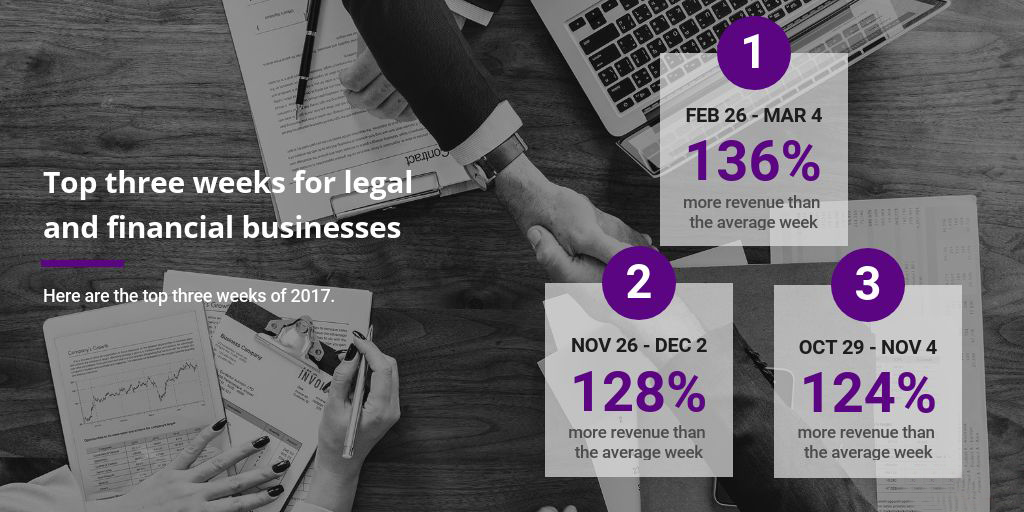
Lastly, we have a look at the three best weeks for legal and financial businesses in 2017, including how much better revenues were in those weeks than the average week.
The best week for legal and financial businesses was the transition week from February to March, which was 136% better than the average week. November 26 to December 2 was the next best week, seeing 128% more revenue than the average week. And for their third best week, we have the transition from October to November, which was 124% better than the average week.
Take action
Are you looking for more insight into your business transactions? Womply can help with that. We specialize in helping small business owners understand their daily operations better and get easy access to better business information. If you want to help maximize your efforts and save a lot of time, check out Womply’s solutions for small businesses. Learn more, plus get free reputation monitoring and customer insights when you sign up for Womply Free!
METHODOLOGY
Womply analyzed daily revenue for 8,389 local, independent legal and financial businesses in all 50 states and the District of Columbia for all 365 days of the 2017 calendar year. Businesses were only qualified for the analysis if Womply had a full year of transaction history and the business recorded multiple transactions per day, on average.