One of the best things to happen to the car was the advent of the dashboard. With a dashboard, you don’t have to guess if you’re about to run out of fuel or need to service the vehicle. You can know, instantly, with zero work required.
Just as drivers need to keep an eye on their fuel gauges, small business owners need to keep an eye on their revenue trends over the course of the year.
Each week we feature the revenue patterns of small businesses in all 50 states and across all major industries to highlight the impact of consumer spending on Main Street. In the past, small business owners have been flying blind when it comes to anticipating revenue trends that have a direct impact on their business. By observing the spending patterns of consumers over the past year, small business owners can better prepare and anticipate what will come this year.
Thanks to Womply’s unique data assets, we have an unparalleled view of consumer spending behaviors and how those behaviors translate into dollars and cents for local, independent businesses. Let’s look at the automotive services sector.
The average week for local auto service businesses
We like to start by establishing a national revenue baseline for the industry we’re analyzing. In this case, we analyzed businesses in these specific categories:
- Auto Body and Paint Services
- Auto Parts and Supplies Businesses
- Auto Repair and Maintenance Businesses
- Auto Wash and Detail Businesses
- Aviation Services
- Gas Stations
- General Auto Services
- Oil and Lube Stations
- Smog Check Stations
- Tire Services
- Towing and Roadside Assistance Businesses
- Truck Repair and Maintenance Businesses
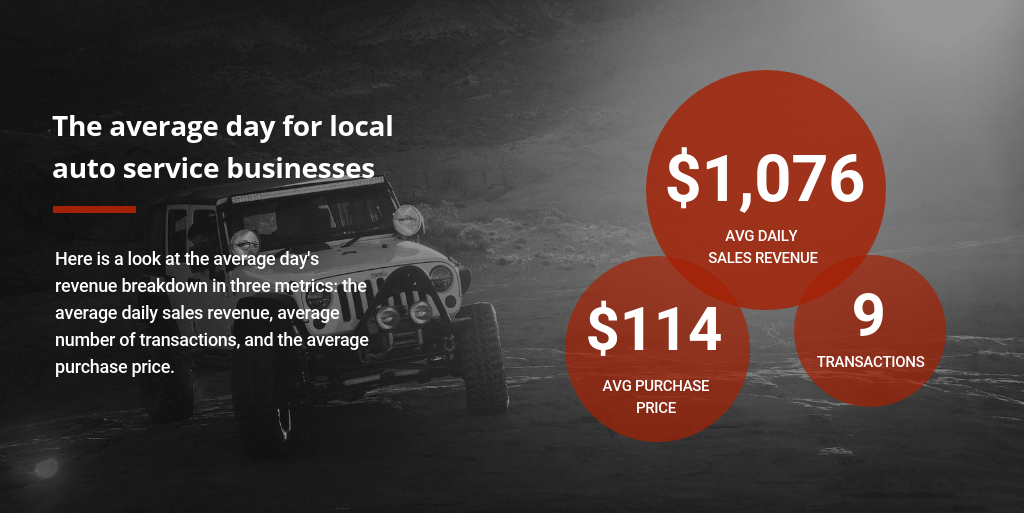
On an average day during the year, these businesses process 9 transactions averaging about a $114 each, bringing average daily sales revenue to $1,076.
Why do we look at these metrics?
Most business owners are very familiar with their daily revenue intake, but a business’s daily revenue is actually the result of two metrics: the number of daily transactions and the average purchase price per transaction. By measuring the average number of times customers transact with a business, we can get a better idea of when those businesses are busiest. And by measuring the average order size or purchase price, we can see how pricing and upselling/cross-selling impact sales.
The average week for local auto service businesses
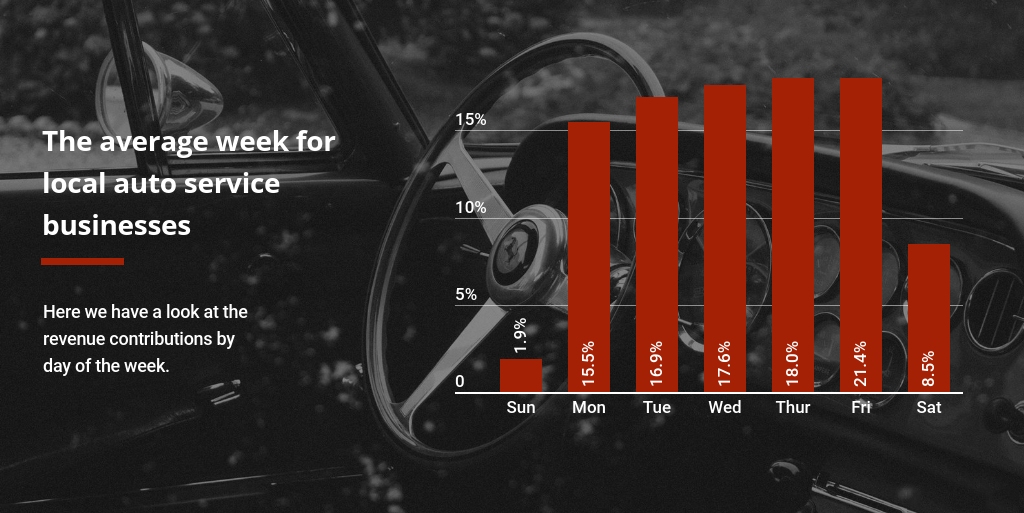
The above graph shows the distribution of revenue for automotive services over the days of the week. It shows us which days are the strongest for revenue, as well as which days of the week are least busy. When it comes to daily revenue contribution, consumers are tending to their vehicles more during the week than on the weekend.
- Sunday – 1.9%
- Monday – 15.5%
- Tuesday – 16.9%
- Wednesday – 17.6%
- Thursday – 18.0%
- Friday – 21.4%
- Saturday – 8.5%
Why do we measure revenue this way?
When businesses can see which days of the week are their biggest revenue contributors, they can better prepare for the forthcoming week. Whether they’re setting employee’s schedules for the week or scheduling deliveries, they can plan more effectively when they know what the average week is like.
The average year for local auto service businesses
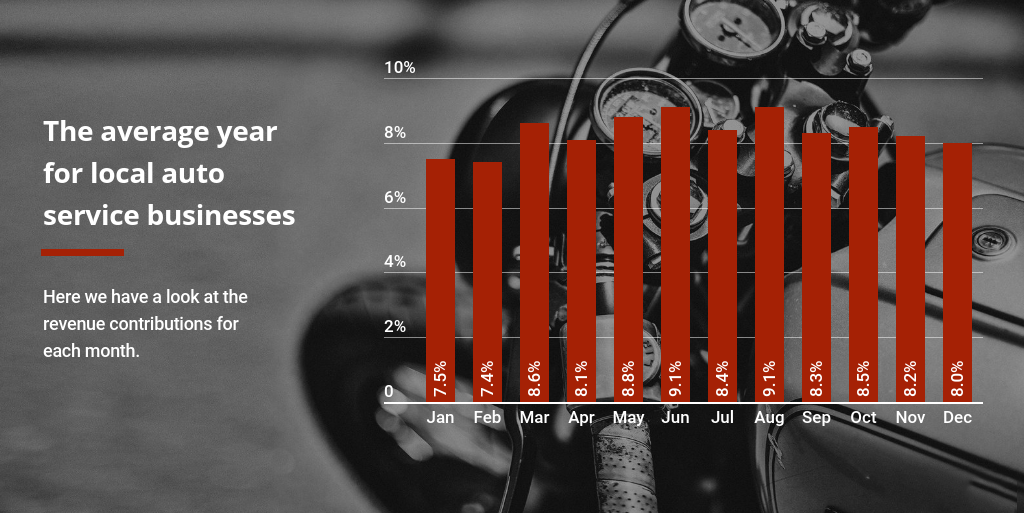
Business owners in the automotive services industry enjoy a rather consistent flow of revenue from month to month. Where other industries, like retail, see large swells in revenue during their peak sales season, those in auto services are on cruise control throughout the year. During their average month, auto service businesses pull in about $26,798 in revenue from 323 transactions.
- Jan – 7.5%
- Feb – 7.4%
- Mar – 8.6%
- Apr – 8.1%
- May – 8.8%
- Jun – 9.1%
- Jul – 8.4%
- Aug – 9.1%
- Sep – 8.3%
- Oct – 8.5%
- Nov – 8.2%
- Dec – 8.0%
Why do we measure revenue this way?
Just as we like to see which days of the week contribute the most to overall revenue, we like to know which months contribute the most to a business’s annual revenue. Small businesses already operate on such thin margins that even the slightest advanced notice of shifting sales patterns can have substantial, positive effects on a business’s bottom line.
The seasonality of local auto service businesses
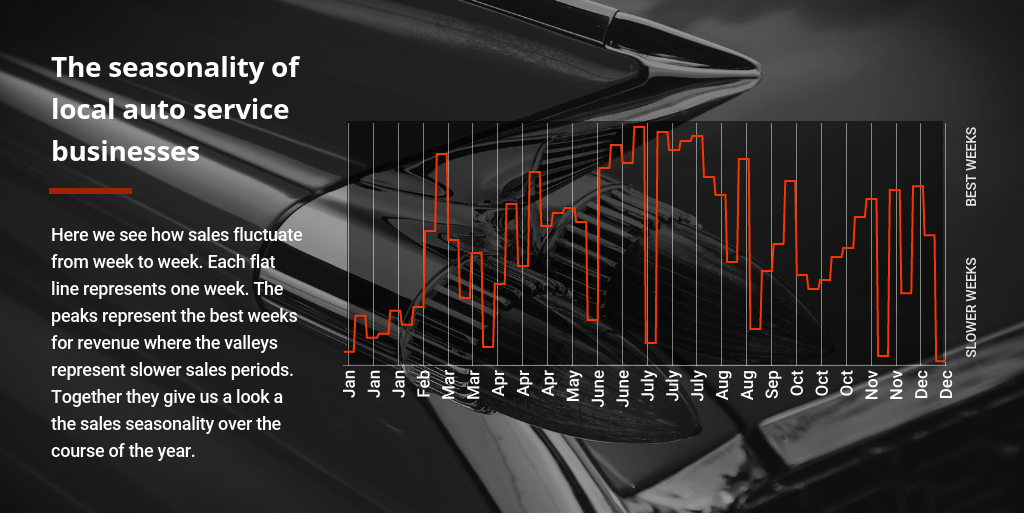
The most interesting thing we see here is the week of the 4th of July. Despite sitting squarely between the first and second best weeks of the year for auto service businesses, the week of America’s Independence Day is the 49th best (out of 52 weeks). Clearly, the 4th of July is a buzzkill for auto services sales, likely due to business closures for the holiday.
Why do we measure revenue this way?
Knowing which months are a business’s best provides a great high-level view of the revenue trends over the year. By looking at the year from a week-to-week basis, small business owners can anticipate the likelihood that upcoming holidays or events will translate into a sales surge or slowdown.
A quick note on this graph: This graph shows week-to-week seasonality over the course of the year. The month labels on the x-axis provide context but don’t exactly represent each month’s four weeks. This is due to some months start mid-week. For example, February started on a Wednesday, because of this, the first week is counted in January’s last week.
The average day for auto service businesses in your state
Below you’ll find each state’s average daily revenue, the amount each customer spends per purchase, and how many customers transact on a daily basis. We’ve also included a national ranking of the states (in Column 2), according to average daily revenue. Washington, D.C. is #1, and Iowa is #51.
| STATE | RANK | DAILY REVENUE | PURCHASE PRICE | TRANSACTIONS |
| Alabama | 19 | $1,082 | $108 | 10 |
| Alaska | 22 | $1,053 | $89 | 12 |
| Arizona | 13 | $1,187 | $78 | 15 |
| Arkansas | 47 | $772 | $62 | 13 |
| California | 7 | $1,299 | $132 | 10 |
| Colorado | 26 | $1,038 | $85 | 12 |
| Connecticut | 5 | $1,382 | $212 | 7 |
| Delaware | 34 | $930 | $104 | 9 |
| D.C. | 1 | $3,204 | $295 | 11 |
| Florida | 32 | $962 | $128 | 8 |
| Georgia | 23 | $1,051 | $110 | 10 |
| Hawaii | 3 | $1,750 | $296 | 6 |
| Idaho | 48 | $772 | $119 | 6 |
| Illinois | 36 | $888 | $101 | 9 |
| Indiana | 40 | $864 | $94 | 9 |
| Iowa | 51 | $565 | $41 | 14 |
| Kansas | 2 | $2,152 | $112 | 19 |
| Kentucky | 29 | $1,024 | $96 | 11 |
| Louisiana | 49 | $757 | $68 | 11 |
| Maine | 20 | $1,069 | $113 | 9 |
| Maryland | 9 | $1,272 | $176 | 7 |
| Massachusetts | 30 | $1,010 | $127 | 8 |
| Michigan | 25 | $1,039 | $101 | 10 |
| Minnesota | 39 | $878 | $112 | 8 |
| Mississippi | 46 | $780 | $88 | 9 |
| Missouri | 50 | $589 | $60 | 10 |
| Montana | 31 | $1,000 | $73 | 14 |
| Nebraska | 37 | $887 | $80 | 11 |
| Nevada | 12 | $1,213 | $106 | 11 |
| New Hampshire | 33 | $932 | $141 | 7 |
| New Jersey | 4 | $1,425 | $151 | 9 |
| New Mexico | 41 | $863 | $102 | 8 |
| New York | 28 | $1,032 | $109 | 10 |
| North Carolina | 24 | $1,049 | $128 | 8 |
| North Dakota | 15 | $1,146 | $172 | 7 |
| Ohio | 45 | $787 | $74 | 11 |
| Oklahoma | 43 | $825 | $63 | 13 |
| Oregon | 6 | $1,359 | $224 | 6 |
| Pennsylvania | 27 | $1,034 | $121 | 9 |
| Rhode Island | 42 | $831 | $75 | 11 |
| South Carolina | 17 | $1,090 | $142 | 8 |
| South Dakota | 38 | $883 | $62 | 14 |
| Tennessee | 21 | $1,054 | $122 | 9 |
| Texas | 10 | $1,260 | $147 | 9 |
| Utah | 11 | $1,253 | $112 | 11 |
| Vermont | 16 | $1,145 | $74 | 15 |
| Virginia | 18 | $1,089 | $138 | 8 |
| Washington | 8 | $1,293 | $143 | 9 |
| West Virginia | 44 | $801 | $86 | 9 |
| Wisconsin | 14 | $1,168 | $145 | 8 |
| Wyoming | 35 | $908 | $86 | 11 |
Take action
Are you looking for more insight into how your business stacks up? Womply can help with that. We specialize in helping small business owners get smarter, faster. Learn more, plus get free reputation monitoring and customer insights when you sign up for Womply Free!
If you haven’t yet, be sure to check out our newly-launched Small Business Almanac. You’ll be able to see how businesses in your industry and state did last quarter. Check it out here.
METHODOLOGY
Womply analyzed daily revenue for 20,022 local, independent auto service businesses in all 50 states and the District of Columbia for all 365 days of the 2017 calendar year. Businesses were only qualified for the analysis if Womply had a full year of transaction history and the business recorded multiple transactions per day, on average.