It’s that time of week again when we dig into small business data, and we’re excited to take a closer look at the seasonality of local gardens and nurseries.
As green thumbs across the country gear up to dig in, their spending habits will help local gardens and nurseries across the country see their best season of their year. In fact, in terms of sales volume, this time of year is better for local nurseries and gardens than November and December are for retailers!
Each week we feature the revenue patterns of small businesses in all 50 states and across all major industries to highlight the impact of consumers who choose to shop locally. In the past, small business owners have been flying blind when it comes to anticipating revenue trends that have a direct impact on their personal and business success and stability. By observing the spending patterns of consumers and how those transactions can empower owners better understand their business, customers, and revenue.
Thanks to Womply’s unique data assets, we have an unparalleled view into consumer spending behaviors and how they translate into dollars and cents for local, independent business owners. With our data, business owners can put their revenue trends into context. So, let’s take a look at what the numbers say about the spring season for gardens and nurseries.
The average week for gardens and nurseries
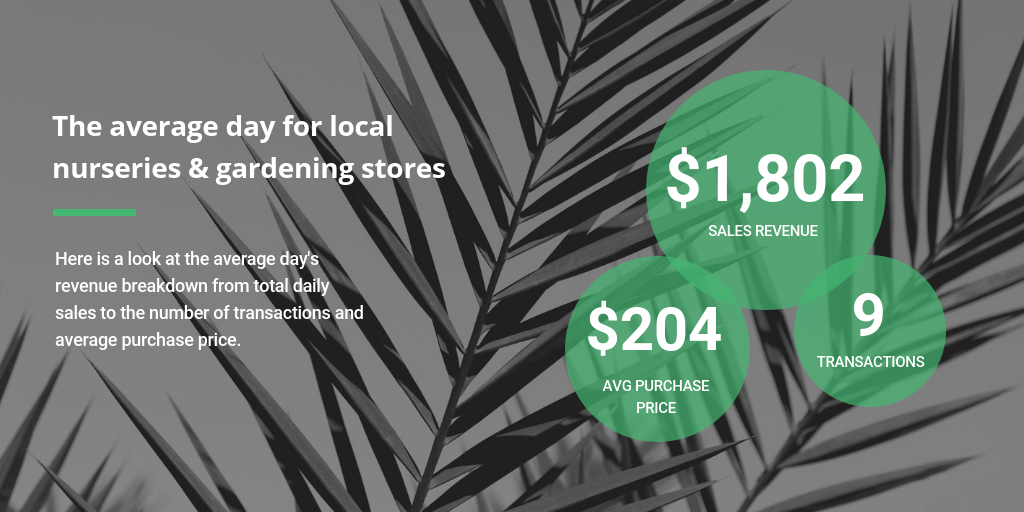
We like to start by establishing a national revenue baseline for the industry we’re analyzing, in this case local gardens and nurseries. On an average day during the year, these businesses process about 9 transactions averaging about a $204 each, bringing average daily sales revenue to $1,802.
Why do we look at these metrics?
Most business owners are very familiar with their daily revenue intake, but a business’s daily revenue is actually the result of two other metrics: the number of transactions you have in a day and the average purchase price per transaction. By measuring the average number of times customers transact with a business, we can get a better idea of when the businesses are busiest. And by measuring the average order size or purchase price, we can see if efforts to upsell or cross-sell are impacting sales.
The average week for gardens and nurseries
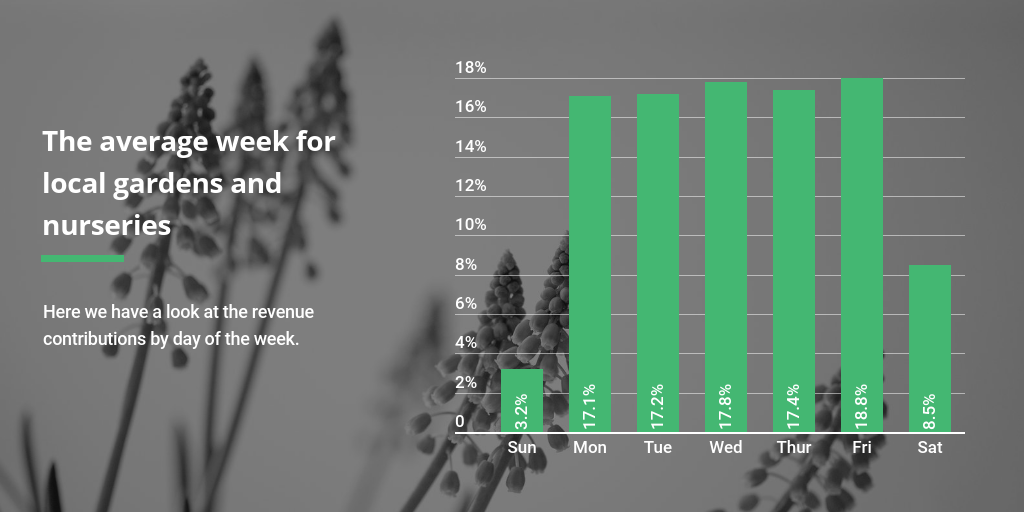
The above graph shows the distribution of revenue for gardens and nurseries over the days of the week. It shows us which days are the strongest for revenue, as well as which contribute the least to the weekly total.
- Sunday – 3.2%
- Monday – 17.1%
- Tuesday – 17.2%
- Wednesday – 17.8%
- Thursday – 17.4%
- Friday – 18.8%
- Saturday – 8.5%
For the most part, each day of the week contributes about what we’d expect, with the exception of Saturday. While most consumers may be saving their yard and garden work for the weekend, they don’t seem to wait until Saturday to buy their supplies.
Why do we measure revenue this way?
When businesses can see which days of the week are their biggest revenue contributors, they can better prepare for the forthcoming week. Whether they’re setting employee’s schedules for the week or scheduling deliveries, they can plan more effectively.
The average year for local gardens and nurseries
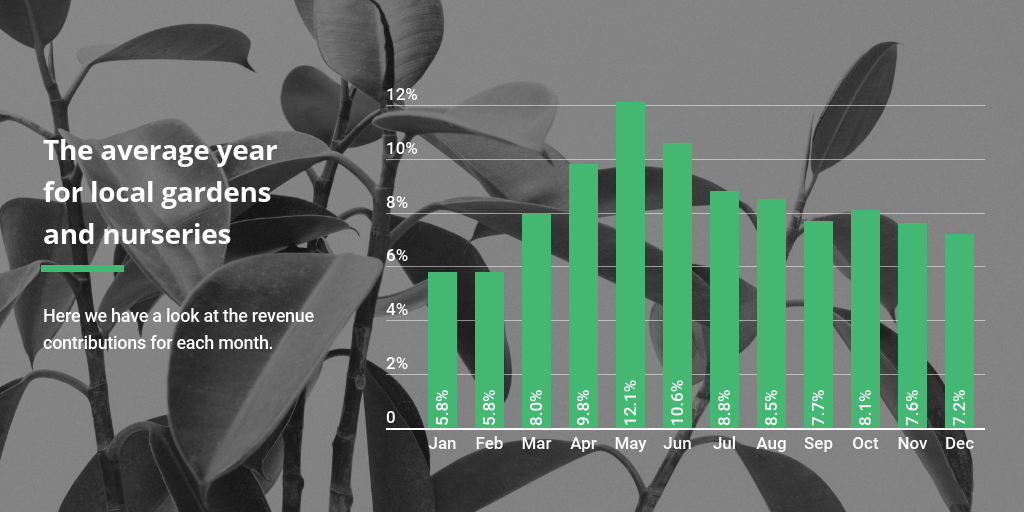
Without a doubt, May is the best time of year for local gardens and nurseries, with June and April taking second and third, respectively. The month of May contributes more than 12% of annual revenue. The average month only contributes about 8.3% to annual revenue. During their average month, garden and nursery owners average about $54,816 in revenue over 268 transactions.
- Jan – 5.8%
- Feb – 5.8%
- Mar – 8.0%
- Apr – 9.8%
- May – 12.1%
- Jun – 10.6%
- Jul – 8.8%
- Aug – 8.5%
- Sep – 7.7%
- Oct – 8.1%
- Nov – 7.6%
- Dec – 7.2%
Why do we measure revenue this way?
Just as we like to see which days of the week contribute the most to overall revenue, we like to know which months contribute the most to a business’s annual revenue. Small businesses already operate on such thin margins that even the slightest advanced notice of shifting sales seasons can have substantial, positive effects on a business’s bottom line. They can stock inventory when the time is right, and they can plan for seasonal hiring more accurately.
The seasonality of local gardens and nurseries
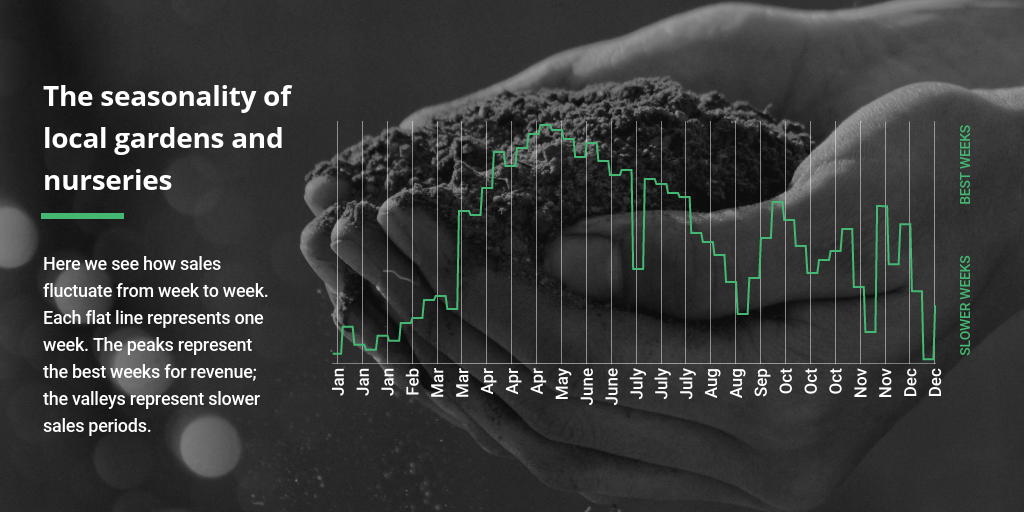
Not surprisingly, spring and summer are the best seasons for gardens and nurseries. It looks as if most consumers rest from their yard work and chores to enjoy the 4th of July, and by August, the majority of their yard work is finished.
A quick note on this graph: This graph shows week-to-week seasonality over the course of the year. The month labels on the x-axis provide context but don’t exactly represent each month’s four weeks. This is due to some months starting mid-week. For example, February started on a Wednesday and ended on a Tuesday. Because of this, the first week is counted in January and its last week is counted in April.
Why do we measure revenue this way?
Knowing which months are a business’s best provides a great high-level view of the revenue trends over the year. By looking at the year from a week-to-week basis, small business owners can anticipate the likelihood that upcoming holidays or events will translate into a sales surge or slowdown.
The biggest sales period for local gardens and nurseries
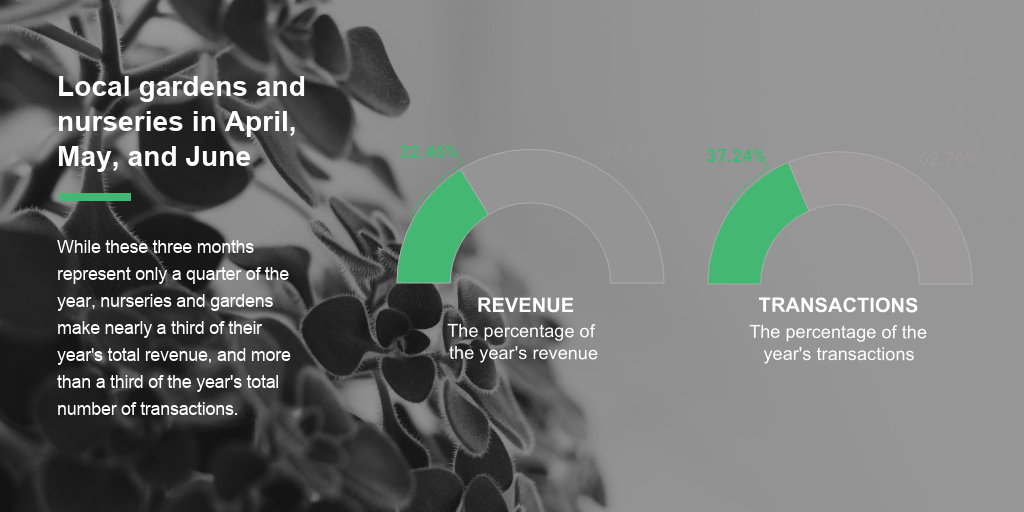
As we saw in the graphs above, April, May, and June are the peak months for consumer spending at local gardens and nurseries. To understand just how significant these months are to the year’s success, we took a closer look to see what percentage of annual revenue during the peak season.
During their peak 3-month season, local gardens and nurseries make nearly a third (32.4%) of their annual revenue. They also process 37.24% of all their transactions for the year. So, these businesses see more customers and make more money.
We also wanted to take a closer look at the average day during this peak season. What we found took us by surprise. It’s wasn’t that revenues and transactions were significantly higher during their peak season. We expected that. What surprised us was that this period of sales was better for nurseries than November and December are for retail sales.
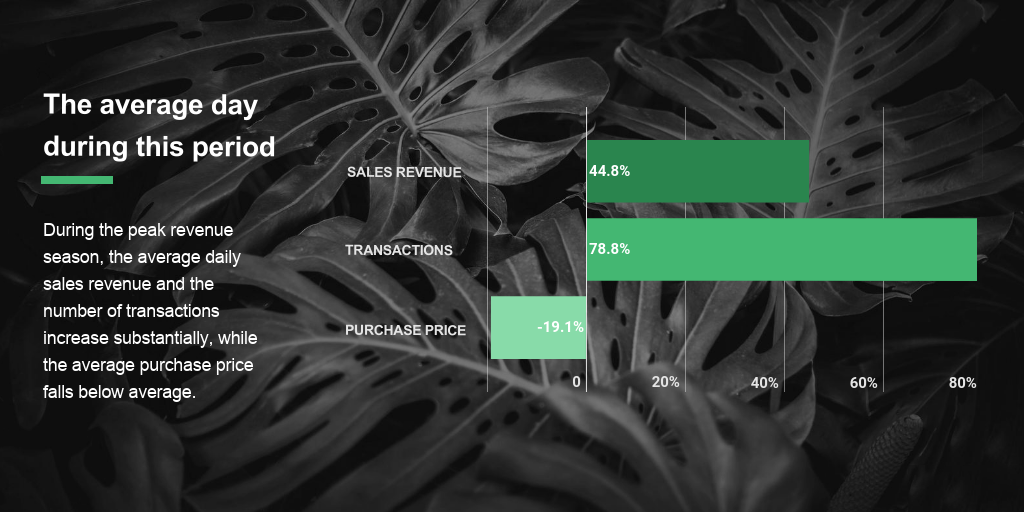
Revenue: To put this in context, retailers only saw an 18.97% bump in sales revenue in November and December, but local gardens and nurseries see revenues increase by 44.8%.
Transactions: In November and December, retailers saw a 22.89% increase in the number of transactions; during peak season for gardens and nurseries, transactions skyrocket by 78.8%.
Purchase price: Interestingly, likely due to the general discounts and incentives, the average purchase price is 19.1% below average. Retailers see a similar negative shift during their holiday surge, but the average purchase price for retailers only drops about 3.19%.
Why do we measure revenue this way?
Every business industry we’ve analyzed has a peak season. For retail, it’s the holidays. For home and garden, it’s late spring/early summer. And for bookstores, it’s back-to-school season. This view shows us what to anticipate on the average day of a business’s peak sales season.
Take action
Are you looking for more insight into how your business stacks up? Womply can help with that. We specialize in helping small business owners get smarter, faster. Learn more, plus get free reputation monitoring and customer insights when you sign up for Womply Free!
If you haven’t yet, be sure to check out our newly-launched Small Business Almanac to see how businesses in your industry and state did last quarter. Check it out here.
METHODOLOGY
Womply analyzed daily revenue for 2,311 local, independent gardens and nurseries in all 50 states and the District of Columbia for all 365 days of the 2017 calendar year. Businesses were only qualified for the analysis if Womply had a full year of transaction history and the business recorded multiple transactions per day, on average.