If hindsight is 20/20, then what better way to prepare for the new month than to take a look at how restaurants did in 2017. Restaurants are one of the most stable business when it comes to seasonality. They don’t vary much from day to day, weekend to weekend, or month to month, but that doesn’t mean each month doesn’t have its unique trends.
Today, we’re looking at how restaurants perform during the month of March. Since restaurants already operate on such thin margins, even the slightest insight into how the week or month will take shape can help restauranteurs stay ahead. As we take a look at last year, we hope it will help you prepare your restaurant for March of this year.
Before we jump in, let’s define the key metrics we used for our analysis:
- Transactions: How many individual payments restaurants processed.
- Ticket size: How much patrons spend on average per transaction.
- Daily sales revenue: The total sales restaurants collect during the average day.
The average day for restaurants in March 2017
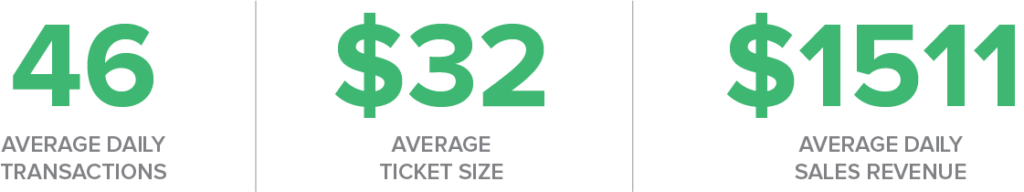
In 2017, March was the fourth-highest revenue month for restaurants, with 8.7% of the year’s total sales coming during the month. In addition, 4 of the top 10 sales days of the year occur in March.
Still, the three key metrics above are all slightly below the national averages for the entire year. On average, restaurants have 48 daily transactions at an average ticket of $35, with average daily revenue of more than $1,700.
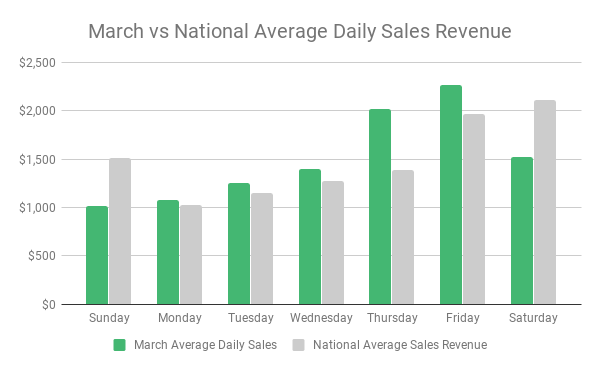
The average week for restaurants in March 2017
Here we see a day-by-day look at the average daily sales revenue in March 2017 compared to the national averages. It’s interesting that Saturdays and Sundays in March under-performed compared to the national trend. Thursday and Friday picked up the slack with strong above-average daily revenue for the month.
How weekends compared to weekdays in March 2017
Last, but not least, let’s look at how the weekend compares to weekdays in March. In the restaurant industry, month-to-month comparisons don’t vary nearly as much as weekends do from weekdays in all three categories.
![]()
![]()
Last year, restaurants saw a 37.5% higher number of transactions in March on the weekend compared to the weekday.
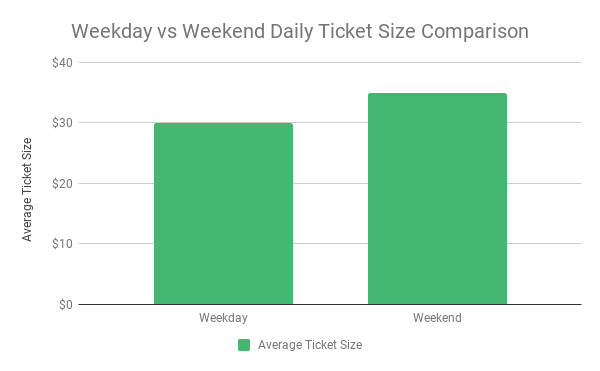
In March 2017, the average ticket size was 16.7% higher on weekends.
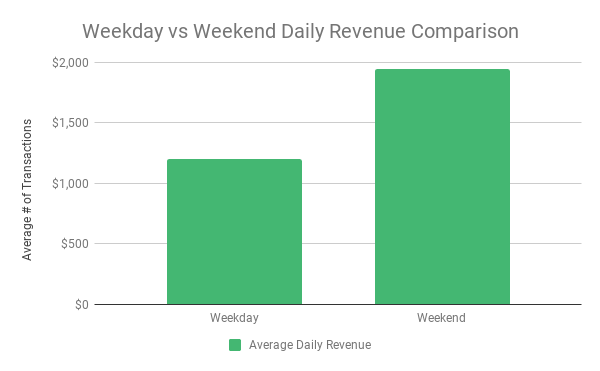
And last year, restaurant’s daily sales soared above weekday sales by 62% in March 2017.
Take action
Would you like to know how your restaurant compares? We specialize in helping all small businesses, not just restaurants, get a deeper view into their business performance so they can stay ahead of trends and seasonality. Learn more, plus get free reputation monitoring and customer insights when you sign up for Womply Free!
Methodology
Womply analyzed daily revenue for 25,893 restaurants in all 50 states and the District of Columbia for all 365 days of the 2017 calendar year. Restaurants were only qualified for the analysis if Womply had a full year of transaction history and the business recorded multiple transactions per day, on average.